
BLOG
+3
Loading...
Cat. #LMN01
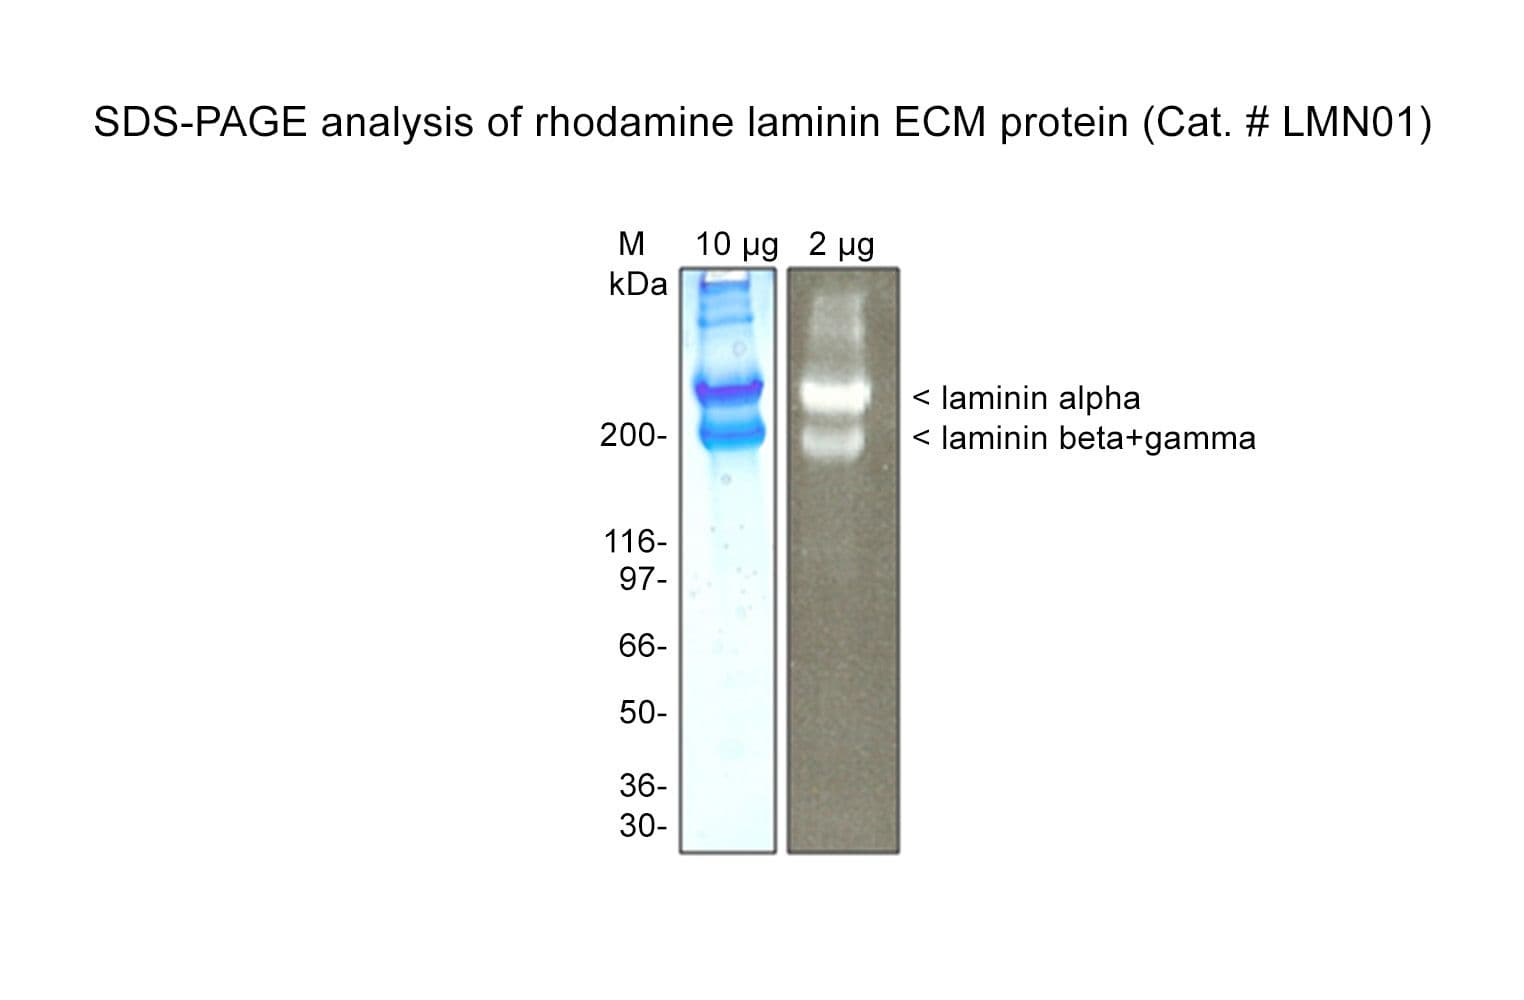
Laminin is purified from Engelbreth-Holm-Swarm (EHS) mouse tumor tissue; it is a high-molecular-weight (~800 kDa) heterotrimeric basement membrane glycoprotein, made up of three subunits that vary in size between 400 kDa (alpha subunit) and 200-225 kDa (beta and gamma subunits).
The protein is modified to contain covalently linked rhodamines at random surface lysines.
Protein purity is determined by scanning densitometry of Coomassie Blue-stained protein on a 4-20% polyacrylamide gel. LMN01 is >90% pure.
Biological activity of LMN01 is demonstrated by its ability to act as a substrate for cell invasion as monitored through an ECM degradation assay.


