About FtsZ Proteins
Sections:
1) Background and research field overview
Identification as a GTPase and character of its polymerization
Homology to tubulin
Status of the research field 2012
2) Lead compound screening and drug development
The need for new anti-bacterials
Cell division proteins as a target
FtsZ homology and consequences for drug targeting
3) Practical aspects of FtsZ assays and biochemistry
Protofilaments versus sheets and filaments
Critical concentration
Buffer hypersensitivity and optimization
Associated ATPase activity
Assay types and recommendations
PC190723 description and assay response
List of figures:
- Structure of parallel FtsZ filaments. (Click Here)
- Effects of PC190723 on FtsZ GTPase. (Click Here)
- Measurement of FtsZ critical concentration. (Click Here)
- Measurement of Enterococcus faecalis FtsZ protein GTPase activity. (Click Here)
- Schematic diagram of FtsZ monomer/polymer reporting fluorescence polarization assay. (Click Here)
- Turbidity measurement of Staphylococcus aureus FtsZ polymerization. (Click Here)
- Dose response of PC190723 affecting the GTPase activity of FtsZ proteins. (Click Here)
Cytoskeleton's selection of Ftsz Proteins can be found here
1. Background and research field overview.
The FtsZ protein (Filamenting temperature sensitive mutant Z, ref.1) is essential for bacterial cell division and an ideal target for novel anti-bacterial drugs. Mutants lacking this protein do not divide, but continue to elongate into filaments. FtsZ is a GTPase (2) that polymerizes in a nucleotide-dependent manner head-to-tail to form single-stranded filaments (Figure 1) that assemble into a contractile ring (3). The ring is called the Z-ring and forms on the inside of the cytoplasmic membrane where it marks the future site of the septum of a dividing bacterial cell. Although FtsZ polymerization rapidly reaches steady state, the Z-ring is dynamically maintained through the course of cell division by continuous and rapid turnover of FtsZ polymers (4,5), likely fueled by FtsZ’s GTP hydrolysis (2,6). FtsZ is the first protein to localize at the division site and recruits other proteins involved in bacterial cell division. Besides serving as a scaffold for the other cell division proteins, FtsZ itself may exert cytokinetic forces that lead to cell division (7-9).
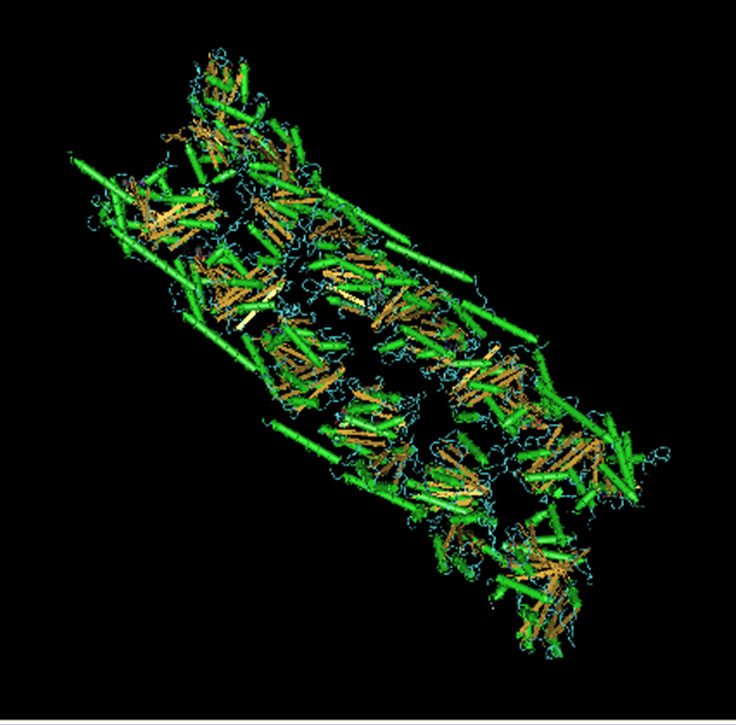
Structure of FtsZ protein determined by X-ray crystallography (10) and oligomeric structure arranged from the monomer (34).
FtsZ has structural similarity to the eukaryotic microtubule subunit called tubulin (10,11), and hence is considered a prokaryotic homolog to this protein (12,13). Both tubulin and FtsZ contain a GTP-binding domain (12,13), have GTPase activity, assemble into protofilaments, two-dimensional sheets, and protofilament rings (14-15), and share substantial structural identities (12,13). Despite these parallels, FtsZ and tubulin only share 10-18% sequence similarity and the basic subunit of FtsZ is a monomer, whereas the tubulin subunit is an alpha and beta heterodimer. Also, the necessity of GTP hydrolysis for FtsZ assembly in vitro varies with experimental conditions (17,18); a FtsZ mutant that assembles, but lacks GTPase activity, leads to altered cellular phenotype and function in vivo (18). Despite the many recent advances in our understanding of FtsZ, many questions remain, including: (i) is the Z-ring a force generating structure or simply a scaffold to localize the proteins involved in cell division; (ii) what is the role of nucleotide hydrolysis in cell division; (iii) where does hydrolysis occur within the filament; (iv) does nucleotide exchange occur in polymers, monomers or both; and (v) what is the nature of the lateral interactions between FtsZ filaments? Additionally, reports of treadmilling (8) and dynamic instability (5) in FtsZ polymerization warrant further study.
2. Lead compound screening and drug development
The unprecedented increase in antibiotic-resistant pathogens and lack of new antibiotic development (19) highlights the need for new anti-microbial drugs active against novel targets such as bacterial cell division proteins (20,21). Recently, FtsZ has become the focus of antibiotic research as a novel target for new anti-microbials (22-27). The amino-acid sequence identity between different FtsZ species is 35 to 99%, and most commonly 40 to 70%; for a detailed homology database, click here. This low to medium level of homology affects drug discovery in two ways: 1. Using one FtsZ protein target will likely generate a highly specific drug to that species, and conversely, 2. It is unlikely that a broad spectrum anti-bacterial FtsZ ligand will be identified. Indeed, Haydon et al (25,26) reported that PC190723, a Staphylococcus aureus FtsZ inhibitor also inhibited FtsZ from Bacillus subtilis, which is 70% homologous to S.aureus FtsZ, but did not inhibit FtsZ isolated from Escherichia coli which has 51% and 47% homology, respectively (Figure 2).
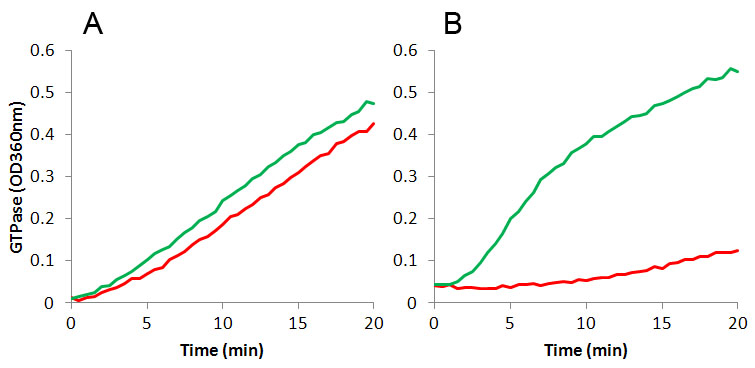
Polymerization of FtsZ protein from E.coli (panel A, Cat. # FTZ05) and S. aureus (panel B, Cat. # FTZ02) in the presence of 15 µM FtsZ inhibitor PC190723 (red line) or buffer only (green line). GTPase activity was measured with a MESG-based assay (Cat. # BK052) using 0.3 mg/ml E.coli FtsZ or 1.0 mg/ml S. aureus FtsZ. See references (25-27) and Figure 7 for additional details.
3. Practical aspects of FtsZ assays and biochemistry
a) Protofilaments versus sheets and filaments
Initial studies of FtsZ filaments found copious structural phenotypes including single filaments, lateral filaments, massive aggregated filaments, circles, and combinations of these (14). Many research studies later, there is a consensus building that the first structure formed after polymerization is the protofilament. These are short filaments with 20 to 50 FtsZ subunits per structure arranged in a head to tail fashion (4, also see Figure 1 above). In vitro, these protofilaments are highly dynamic with a half-life or turnover between 5 and 20 seconds; thus, in a GTPase assay the signal is a combination of multiple cycles of turnover. The GTPase activity is tightly coupled to turnover, and hence is a reliable indicator of FtsZ dynamics. In a 1 mg/ml solution, the FtsZ concentration is approximately 20 µM, which means that in one cycle approximately 20 µM of GTP is hydrolyzed. A full cycle is essentially completed in 60 sec, meaning the expected amount of phosphate released with 10 min incubation would be 200 µM. Indeed, this is what is obtained (for example, see datasheets FTZ02, FTZ03, FTZ04 and FTZ05). In vivo, these protofilaments likely align laterally at the bud neck to form a force generating matrix (7,8,9), while maintaining their highly dynamic nature (4,28). The protofilament is sedimentable but only at a g-force of >200,000. This aspect, in combination with their highly dynamic nature described above, somewhat limits the usefulness of centrifugation to study these filaments (but see below for discussion of other assay types).
Sheets and filaments (SF) are created from protofilaments and require different buffer conditions. Essentially, buffers either contain aggregation promoting agents such as crowding agents like the sugar polymers Ficoll and dextran, or the buffer would have a lower pH which also promotes aggregation. Many different type of SF structures are formed, but since they are GTP dependent, they are considered a reasonable interpretation of physiological function. In practical terms, the SFs are useful for several reasons: 1) to determine a critical concentration because they sediment at only 50,000 x g; 2) analysis of protein interactions by spin-down assays; and 3) following polymerization by turbidity because SFs scatter light. The GTPase activity is initially rapid which corresponds to the polymerization phase, but then the aggregation into filaments and sheets causes a reduction in GTPase activity (reduction in dynamics), which in some cases cannot be detected. Because of the rapid initial GTPase activity, this condition is sometimes not suitable for drug screening by GTPase measurement because the Pi release cannot be measured rapidly in normal plate readers. SFs can also be detected by turbidity at 340 to 500 nm (see Section 3 on assays).
b) Critical concentration
Critical concentration (CC) is a measure of the ability of a polymerizing protein to form filaments. In particular, it is the highest concentration of monomers that can exist without forming polymers (Figure 3). As you might expect, it is highly dependent on conditions such as buffer components, drug concentration, and temperature. In general, FtsZ proteins are quoted in optimal buffers to have CC values of 0.1 to 0.4 mg/ml. A practical consequence is that for protofilament formation, and hence GTPase based drug screening, the concentration must be sufficiently above this value to enable GTPase polymerization. As a rough estimate, good signals can be obtained at 0.4 to 0.6 mg/ml above the CC; however, E.coli FtsZ is a special case where only 0.2 mg/ml is required above its CC of 0.1 mg/ml (total of 0.3 mg/ml). Another special case is S. aureus FtsZ which has a nucleation phase prior to polymerization similar to tubulin polymerization (see Figure 6). In this case, one needs to choose a time point that is sufficiently past the nucleation and polymerization phase to enable a steady state reading.
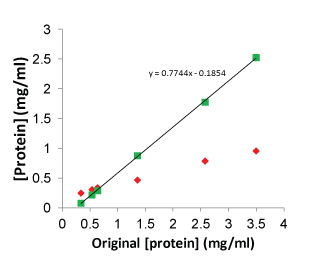
Streptococcus pneumoniae FtsZ protein (Cat. # FTZ03) was polymerized in Buffer 4 (see text for recipe) at 0.25 to 3.0 mg/ml. After 10 min incubation at 37°C, samples were centrifuged at 100,000 x g for 30 min. Supernatants were removed to new tubes and pellets were resuspended in Milli-Q water. Both pellets and supernatants were assayed for protein and the results plotted on the graph. The constant of the fitted line equation indicates the critical concentration in mg/ml (0.19 mg/ml).
c) Buffer hypersensitivity and optimization
Due to Cytoskeleton’s knowledge of multiple FtsZ proteins, we have been able to compare their activities under different conditions. We find there is a wide range of responses to different buffer conditions, making it essential to use the optimized buffer for the best results. The variation is so great that in some cases changing from a K-acetate salt to a KCl salt will completely abolish protofilament formation and GTPase activity (e.g., see FTZ02 datasheet). The cause is probably the low to medium homology described in Section 1 above, and it’s not surprising that biochemical reports over the years have described their own unique buffer recipe for each type of different species’ FtsZ protein (e.g., 5,24,33). In some cases where a generic buffer was used, GTPase activity could not be detected and another assay format was utilized (31). At Cytoskeleton, we have used these publications as a starting point to develop a four buffer system that can be used to rapidly identify the buffer appropriate for your FtsZ protein and its application. These buffers are:
Buffer 1
50 mM MES-KOH pH 6.5,
50 mM KCl
5 mM MgCl2.
Main ref: 5.
Buffer 2
50 mM Hepes-KOH pH 6.8,
250 mM KCl,
5 mM Mg-acetate.
Main ref: 24.
Buffer 3
50 mM Hepes-KOH pH 7.5,
300 mM K-acetate,
5 mM Mg-acetate.
Main ref: 24.
Buffer 4
50 mM Hepes-KOH pH 7.5,
100 mM K-glutamate,
300 mM K-acetate,
5mM Mg-acetate.
20% Ficoll 70K (For GTPase Assay with BK052, titrate Ficoll to 10-15% i.e. no SFs)
Main ref: 33.
These buffers have been used to optimize the GTPase activity of four FtsZ proteins from E.coli, E.faecalis, S.aureus and S.pneumoniae which are supplied by Cytoskeleton (Table 1).
Table 1: GTPase buffer optimization for four species’ FtsZ proteins.
Species | Buffer 1* | Buffer 2* | Buffer 3* | Buffer 4* |
E.coli | 28 | 24*** | 19*** | 0.6*** |
E.faecalis | 5.8 | 10 | 16*** | 16*** |
S.aureus | 15 | 0 | 14 | 0 |
S.pneumoniae | 8.8 | 0 | 21** | 0 |
Notes: Optimal protofilament GTPase assay buffer is in bold type and optimal sheet-filament buffer is underlined.
* GTPase activity represented in nmole phosphate / mg FtsZ / min.
** K-acetate was further optimized to 600 mM.
*** ATPase is high in these combinations.
Buffer 4 with 15 or 20% Ficoll (70kDa) is the best for SF formation in most cases; however, S aureus FtsZ requires Buffer 1 for this application (see datasheets FTZ02, FTZ03, FTZ04, FTZ05 for recommended SF and GTPase Buffers).
In Table 1 the optimal protofilament GTPase buffer is in bold type. In some cases this is not the most active GTPase signal (e.g., E. faecalis), but there are other considerations why a particular buffer has been chosen. One reason is the inherent ATPase activity that is associated with many FtsZ proteins (to be published), which may interfere with bona fide assay design for drug screening.
d) Associated ATPase activity
Many of the pure FtsZ preparations we have investigated have an associated ATPase activity. This activity appears to be connected to FtsZ polymer formation because when activity is measured in the presence of GTP and ATP together, the Pi release rate is the same as the GTPase rate. In addition, the drug PC190723 causes increased GTPase and ATPase activity. We are investigating this further and will be reporting it in the literature in the near future. The buffer is critical in determining the ratio of GTPase to ATPase activity. For example, in Buffer 1, which is the main buffer cited for E.coli FtsZ studies, the GTPase / ATPase ratio is >100; however, the same preparation of FtsZ in Buffer 2, 3, or 4 will have a ratio of 7.4, 3.4, and 0.3, respectively. These are quite incredible differences and are useful knowledge when designing a drug screen or GTPase assay for research. Therefore, as a precaution we recommend using the buffer that creates the highest GTPase/ATPase ratio when performing an assay.
e) Assay types and recommendations
Several types of assays have been used to measure FtsZ polymerization or drug binding events. These include GTPase, fluorescence quenching, FRET, fluorescence polarization, sedimentation, and light scatter assays. The requirements for lead identification screening and drug development are best served by the GTPase assay, fluorescence polarization, and fluorescence quenching formats (click here for FtsZ Similarity Homology Table). Conversely, fundamental research on protein interaction studies can utilize sedimentation and GTPase assays effectively.
The GTPase assay is a homogenous assay format that gives kinetic data of phosphate release. Because GTPase activity is tightly linked to protofilament formation and turnover, measuring this activity gives a good report on the status of the dynamic nature of the polymers. Cytoskeleton offers the MSEG based GTPase assay format which has been optimized for running in a 384 well format. In this format, the Z’ values are greater than 0.6 and the CVs are approximately 4.8%. (Figure 4). This format is the most cost effective because we are measuring an enzyme activity.
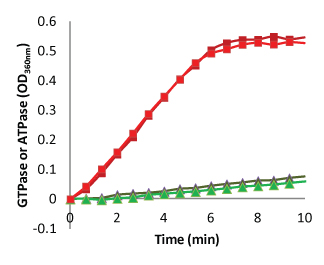
Enterococcus faecalis FtsZ protein (Cat. FTZ04) was polymerized in Buffer 2 (see text for recipe) and phosphate release was measured by coupling to a MSEG/PNP reporter (Cat. BK051). Symbols: red and dark red are GTPase duplicates, green and dark green are ATPase duplicates. Note the closeness of duplicates and the very low ATPase activity.
Fluorescence polarization is used to measure ligand binding, and possibly could be used for monomer to polymer transition. The ligand binding assay needs to have a fluorescence parent ligand present which competes with new analogs. Thus, it’s quite limited in finding new binding sites because fluorescent conjugates are not readily available for multiple compounds. However, using fluorescent FtsZ, it should be possible to use this format to create a homogenous assay which reports on the equilibrium between monomer and multiples of monomer (polymers) (Figure 5). Cytoskeleton will provide fluorescent conjugates of FtsZ on a custom basis. Please inquire for a quotation for this service. This format should be the most cost effective monomer/polymer ratio reporting format because small volumes can be utilized.
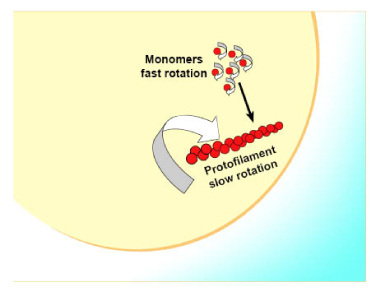
Hypothetically, labeling FtsZ monomer will create a spin reporter protein that changes spin rate when it polymerizes. The change in spin rate is detected by fluorescence polarization.
Fluorescence and fluorescence quenching has been used to study FtsZ polymerization and develop lead compounds (29,30), but the format is complicated in different species due to the high CC of non-E.coli species’ FtsZ polymerization.
Sheet and filament (SF) formation creates a turbid solution similar to the turbidity measured in microtubule polymerization assays. ODs of 340 to 500 nm can be used for detection. The extent of OD change is dependent on the concentration of SFs, which leads to the first caveat of this assay. FtsZ polymerization usually requires just 1 mg/ml of protein, which gives an OD440nm of 0.10 (Figure 6). This is low for screening applications, but can be used for research purposes. Increasing the concentration creates a larger OD, but also a faster polymerization, which is more difficult to measure. The second caveat is that when the SF forms, this is basically an aggregation phenomenon, which means there is no size limit to aggregation. After the initial polymerization, the signal becomes erratic due to large aggregates moving through the light beam. Finally, the cost of this format is controlled by the amount of protein which is usually 100 µg per assay and is considered an expensive format.
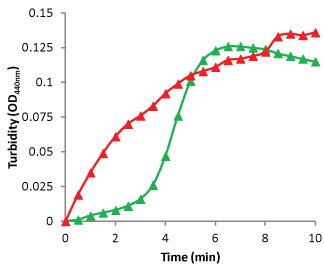
Staphylococcus aureus FtsZ polymerization was detected by measurement of turbidity at OD440nm. One hundred microliters of a 1.0 mg/ml solution of S. aureus FtsZ was pipetted into a well of a half-area plate containing 10 µl of 10 mM GTP and incubated at 37°C. OD440nm was read every 30 seconds for 10 min. Green line = Control FtsZ in buffer. Red line = FtsZ in buffer plus PC190723. Note the immediate increase of polymer in the PC190723 containing reaction, and the lag of polymer formation in the Control reaction.
f) PC190723 description and assay response
PC190723 is a drug, which like paclitaxel binding to tubulin and microtubules, causes enhanced polymer formation with initially rapid hydrolysis of GTP and an overall reduction in CC. High concentrations of the drug (>30 µM) cause rapid polymerization and a very stable polymer mass, usually as protofilaments. The GTPase activity over time decreases to 40% of the control rate, probably due to reduced dynamics, although some dynamics are still apparent. At drug concentrations between 1 and 10 µM, the drug increases the initial and steady state rate of GTP hydrolysis, which indicates an increased turnover or number of protofilaments. These findings are exemplified by the dose response curve of the GTPase activity (see Figure 7). The effects of PC190723 are not a typical inhibitor profile and other more common dose response profiles have been reported (20,32).
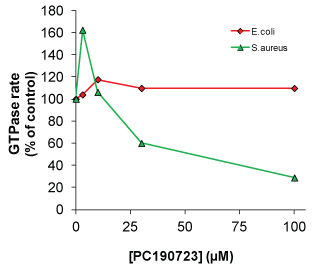
FtsZ protein from E. coli (Red line, Cat. # FTZ05) and S. aureus (Green line, Cat. # FTZ02) in the presence of FtsZ inhibitor PC190723. GTPase activity was measured with a MESG-based assay (Cat. # BK052) using 0.3 mg/ml E.coli FtsZ or 1.0 mg/ml S. aureus FtsZ. Note enhanced GTPase activity at 3 µM PC190723 in the S. aureus FtsZ samples compared to all other concentrations of E. coli FtsZ.
References
- Ishikawa H, Kuroiwa T, and Nagata K. (1954). 『細胞生物学事典』. 朝倉書店. pp. 159–160. ISBN 978-4254171181.
- de Boer P, Crossley R, and Rothfield A. (1992). The essential bacterial cell-division protein FtsZ is a GTPase. Nature. 359, 254-256.
- Bi E and Lutkenhaus J. (1991). FtsZ ring structure associated with division in Escherichia coli. Nature. 354, 161-164.
- Chen Y and Erickson HP. (2005). Rapid in vitro assembly dynamics and subunit turnover of FtsZ demonstrated by fluorescence resonance energy transfer. J. Biol. Chem. 280, 22549-22554.
- Popp D and Robertson RD. (2010). Suprastructures and dynamic properties of Mycobacterium tuberculosis FtsZ. J. Biol. Chem. 15, 11281-11289.
- Mukherjee A and Lutkenhaus J. (1994). Guanine nucleotide-dependent assembly of FtsZ into filaments. J. Bacteriol. 176, 2754-2758.
- Romberg L. and Levin PA. (2003). Assembly dynamics of the bacterial cell division protein FtsZ: Poised at the edge of stability. Annu. Rev. Microbiol. 57, 125-154.
- Erickson HP, Anderson DE, and Osawa M. (2010). FtsZ in bacterial cytokinesis: cytoskeleton and force generator all in one. Microbiol. Mol. Biol. Rev. 74, 504-528.
- Mingorance J, Rivas G, Vélez M, Gómez-Puertas P, Vicente M. (2010). Strong FtsZ is with the force: mechanisms to constrict bacteria. Trends Microbiol. 18, 348–56.
- Lowe J and Amos LA. (1998). Crystal structure of the bacterial cell-division protein FtsZ. Nature. 391, 203-206.
- Lowe J. (1998). Crystal structure determination of FtsZ from Methanococcus jannaschii. J. Struct. Biol. 124, 235-243.
- Erickson HP. (1995). FtsZ, a prokaryotic homolog of tubulin? Cell. 80, 367-370.
- de Pereda JM, Leynadier D, Evangelio JA, Chaco´n P. and Andreu JM. (1996). Tubulin secondary structure analysis, limited proteolysis sites, and homology to FtsZ. Biochemistry. 35, 14203-14215.
- Erickson HP, Taylor DW, Taylor KA. and Bramhill D. (1996). Bacterial cell division protein FtsZ assembles into protofilament sheets and mini-rings, structural homologs of tubulin polymers. Proc. Natl. Acad. Sci. USA. 93, 519-523.
- Erickson HP. (1997). FtsZ, a tubulin homologue in prokaryotic cell division. Trends Cell Biol. 7, 362-367.
- Erickson HP. (1998). Atomic structures of tubulin and FtsZ. Trends Cell Biol. 8, 133-137.
- Mukherjee A and Lutkenhaus J. (1998). Dynamic assembly of FtsZ regulated by GTP hydrolysis. EMBO J. 17, 462-469.
- Mukherjee A, Saez C, and Lutkenhaus J. (2001). Assembly of an FtsZ mutant deficient in GTPase activity has implications for FtsZ assembly and the role of the Z ring in cell division. J. Bacteriol. 183, 7190-7197.
- Mintz C. (2011). Why the antibiotic discovery business needs to be revamped. Life Science Leader. https://www.lifescienceleader.com. October 2011.
- Kumar K, Awasthi D, Berger WT, Tonge PJ, Slayden RA, and Ojima I. (2010). Discovery of anti-TB agents that target the cell-division protein FtsZ. Future Med. Chem. 2, 1305-1323.
- Schaffner-Barbero C, Martín-Fontecha M, Chacón P. and Andreu, JM. (2011). Targeting the assembly of bacterial cell division protein FtsZ with small molecules. ACS Chem. Biol. DOI: 10.1021/cb2003626.
- Margalit DN, Romberg L, Mets RB, Hebert AM, Mitchison TJ, Kirschner MW. and RayChaudhuri D. (2004). Targeting cell division: small-molecule inhibitors of FtsZ GTPase perturb cytokinetic ring assembly and induce bacterial lethality. Proc. Natl. Acad. Sci. USA. 101, 11821-11826.
- Haydon DJ, Stokes NR, Ure R, et al. (20 authors) (2008). An inhibitor of FtsZ with potent and selective anti-Staphyloccocal aureus activity. Science. 321, 1673-1675.
- Andreu JM, Schaffner-Barbero C, Huecas S, Alonso D, Lopez-Rodriguez ML, Ruiz-Avila LB, Núñez-Ramírez R, Llorca O, Martín-Galiano AJ. (2010). The antibacterial cell division inhibitor PC190723 is an FtsZ polymer-stabilizing agent that induces filament assembly and condensation. J. Biol. Chem. 285, 14239-14246.
- Sass P, Josten M, Famulla K, Schiffer G, Sahl H-G, Hamoen L. and Brötz-Oesterhelt H. (2011). Antibiotic acyldepsipeptides activate ClpP peptidase to degrade the cell division protein FtsZ. Proc. Natl. Acad. Sci. USA. 108, 17474-17479.
- Mathew B, Srivastava S, Ross LJ, Suling WJ, White EL, Woolhiser LK, Lenaerts AJ, Reynolds RC. (2011). Novel pyridopyrazine and pyrimidothiazine derivatives as FtsZ inhibitors. Bioorg. Med. Chem. 19, 7120-7128.
- Haydon DJ, Bennett JM, Brown D, et al (20 authors) (2010). Creating an antibacterial with in vivo efficacy: synthesis and characterization of potent inhibitors of the bacterial cell division protein FtsZ with improved pharmaceutical properties. J. Med. Chem. 53, 3927-3936.
- Adams DW, Wu LJ, Czaplewski LG, and Errington J. (2011). Multiple effects of benzamide antibiotics on FtsZ function. Molecular Microbiology. 80, 68-84.
- Trusca D and Bramhill D. (2002). Fluorescent assay for polymerization of purified bacterial FtsZ cell-division protein. Anal. Biochem. 307, 322-9.
- Chen T, Bjornson K, Redick S, and Erickson HP. (2005). A Rapid Fluorescence Assay for FtsZ Assembly Indicates Cooperative Assembly with a Dimer Nucleus. Biophys. J. 88, 505–514.
- Baliga R, Guo D, Tomasevic N, Jia Z, de Hostos E , Brejc K, Sakowicz R, Lichtsteiner S, Pierce SW, and Finer JT. (2005). A Comparison of Two High-Throughput Assays for FtsZ Inhibitors. American Society of Cell Biology (ASCB) December, 2005, poster 653.
- Stokes NR, Sievers J, and Barker S. (2005). Novel Inhibitors of Bacterial Cytokinesis Identified by a Cell-based Antibiotic Screening Assay. J. Biol. Chem. 280, 39709–3971.
- Gonzales JM, Jimenez M, Velez M, Mingorance J, Andreu JM, Vicente M, and Rivas G. (2003). Essential cell division protein FtsZ assembles into one monomer-thick ribbons under conditions resembling the crowded intracellular environment. J. Biol. Chem. 278, 37664-37671.
- Aylett CHS, Wang Q, Michie, KA, Amos LA, and Lowe J. (2010). Filament structure of bacterial tubulin homologue TubZ. Proc. Natl. Acad. Sci. USA. 107, 19766-19771.
