Live Cell Imaging of the Actin Cytoskeleton
Recent advances in organic chemical synthesis have facilitated the ultimate aim of producing small cell-permeable compounds which can efficiently label the actin cytoskeleton and track its dynamic properties1-3. Traditional methods of visualizing F-actin in cells and tissues have relied on microinjection of pre-labeled actin protein4,5 (Fig. 1), fluorescently labeled phalloidin-like molecules6,7, or the use of genetic constructs encoding for either GFP-actin8,9 or GFP-actin binding protein peptides10-12.
Clearly the process of labeling actin with a fluorophore (e.g., rhodamine) and setting up a microinjection apparatus is a time-consuming process, but it can be efficient if the labeled actin is purchased and the microinjection system is available in a core facility or neighboring laboratory. This technique is particularly suited either to large cell types such as 1 mm diameter Xenopus oocytes which allow relatively simple injection methods to be developed, or to cell types that are sensitive to transfection reagents or recalcitrant to uptake of the newly developed Spirochrome™ reagents1-3 (Fig. 2). The major advantages of the microinjection approach are a) the complete integration of labeled actin with the actin cytoskeleton as there is neither steric hindrance from bulky GFP labels nor inhibition of dynamic properties by phalloidin-type F-actin stabilizing molecules, b) rapid experimental observation, usually within minutes, after full dispersal of the injection is achieved, and c) fluorescence recovery after photobleaching (FRAP) methods can be used to measure dynamic turnover13. In addition, muscle and non-muscle pre-labeled actins are commercially available (Cat. # AR05 and APHR, respectively), which allow the operator to create a close actin isoform match to the intended cell type, which improves dispersal of the label and hence, more complete visualization.

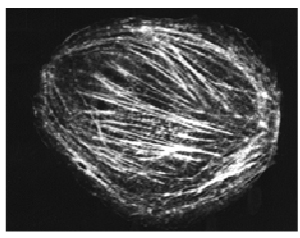
Fig. 1. Rhodamine-labeled non-muscle actin (Cat. # APHR) microinjected into a COS cell. (reproduced with permission, Dr. R. Goldman laboratory, Northwestern University).
Genetic constructs of GFP-actin have been widely used in recent years due to their compatibility with ongoing DNA and RNA transfection experiments8,9. Hence, simple incorporation into the pre-transfection mixture of oligonucleotides allows the operator to visualize after a 24-48h incubation. The caveats are a) the time required to develop a signal, b) heterogeneity in the labeled cell population due to inconsistent transfection, and c) steric hindrance of the relatively large GFP moiety which creates a GFP background and sometimes exclusion from zones of high dynamic turnover near the cell periphery.
GFP-labeled actin binding peptides are also widely used due to the same benefits stated above for GFP-actin. Peptides derived from actin binding proteins such as ABP140 (Saccharomyces cerervisiae), ABP120 (Dictyostelium discoideum), and talin (Homo sapiens) have been used with varying degrees of success10-12. The ability to bind all F-actin populations with high affinity and generate a low background is key to these constructs, some of which are available commercially (e.g., ABP140 and ABP120) whereas others are available from various academic laboratories.
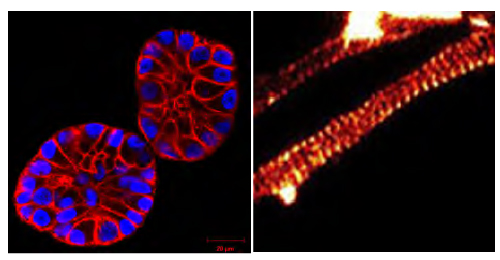
Fig. 2. (Left panel) SiR-actin-treated MCF10A cells in a 3D matrix (Courtesy of Christian Conrad and Katharina Jechow, Heidelberg). (Right panel) SiR-actin-labeled axon showing an actin banding pattern with 180 nm spacing (Courtesy Of Elisa D'Este, MPI Biophysical Chemistry, Göttingen; Ref. 3).
The same caveats as GFP-actin exist for these constructs but to different degrees depending on cell type. Attempts to convert the reagents into a fluorophore-conjugated peptides that are cell-permeable, which would offer a much simplified labeling technique, have not yet been successful. The Spirochrome™ reagents (e.g., SiR-actin) (Fig. 2) have recently transcended many caveats of the systems described above. Developed by Lukinavicius et al.3 in 2014 in the laboratories of Drs. Johnsson, Hell, and Arndt, these small silicon rhodamine-based fluorogenic molecules are cell-permeable and are considered biosensors in the sense that their fluorescence increases up to 100X fold when bound to F-actin. In addition, the probes operate in the far-red spectrum, reducing autofluorescence of the sample and avoiding possible phototoxic effects of the excitation light. These are revolutionary properties because it means the background is much reduced in the unbound state in the cytoplasm, so the affinity of binding to F-actin does not need to be so high, which allows these molecules to bind but not interfere with dynamics, in contrast to the unlabeled parent molecules (e.g., phalloidin and jasplakinolide). Such parent molecules, amongst others, were tested during development and found to have different properties, whereas the jaskplakinolide derivative was the best combination of cell permeability and broadly-dispersed F-actin staining3. Many cell types have been labeled with this system (see www.cytoskeleton.com/spirochrome) and sometimes challenging ones require either a permeabilizing additive6 (e.g., saponin) or an efflux pump/Ca2+ channel inhibitor (e.g., verapamil; see www.cytoskeleton.com/spirochrome) to improve the degree of labeling. The technique is simply to add the fluorogenic reagent to a cell culture and incubate for a short time period, usually only 1-4h. These reagents are now commercially available through Cytoskeleton, Inc.
In conclusion, the techniques of visualizing F-actin in live cells have evolved from a highly specialized, labor-intensive method of actin preparation, labeling, and microinjection, through easier processes of DNA transfection, and finally to the most simple and widely applicable approach of just adding a reagent to the cell culture medium. Future directions will clearly be to bring the latest techniques to the full spectra of cell lines and tissues, and create a broader array of fluorophores.
Spirochrome™ is a trademarks of Spirochrome AG (Switzerland).
Live Cell Imaging Probes
Cytoskeleton Kit (Includes SiR-Actin, SiR-Tubulin, and Verapamil) (Cat. # CY-SC006)
SiR-Actin Kit (Cat. # CY-SC001)
SiR-Tubulin Kit (Cat. # CY-SC002)
PTMtrue™ Antibodies
Anti-Acetyl Lysine Mouse Monoclonal Antibody (Cat. # AAC01)
Anti-Phosphotyrosine Mouse Monoclonal Antibody (Cat. # APY03)
Anti-Phosphotyrosine-HRP Mouse Monoclonal Antibody (Cat. # APY03-HRP)
Anti-SUMO 2/3 Mouse Monoclonal Antibody (Cat. # ASM23)
Anti-SUMO 2/3 Mouse Monoclonal Antibody (Cat. # ASM24)
Anti-Ubiquitin Mouse Monoclonal Antibody (Cat. # AUB01)
Labeled Proteins
Rhodamine Actin Protein (Human Platelet, Non-muscle, >99% pure) (Cat. # APHR)
Rhodamine Actin Protein (Rabbit Skeletal Muscle, >99% pure) (Cat. # AR05)
AMCA Labeled Tubulin (Porcine Brain, >99% pure) (Cat. # TL440M)
Rhodamine Labeled Tubulin (Porcine Brain, >99% pure) (Cat. # TL590M)
X-Rhodamine Labeled Tubulin (Bovine Brain, >99% pure) (Cat. # TL620M)
HiLyte Fluor™ 647 Labeled Tubulin (Cat. # TL670M)
References
- Lukinavicius G. et al. 2013. A near-infrared fluorophore for live cell super-resolution microscopy of cellular proteins. Nature Chem. 5, 132-139.
- Lukinavicius G. et al. 2014. Fluorogenic probes for live-cell imaging of the cytoskeleton. Nat. Methods. 11, 731-3.
- D’Este E. et al. 2015. STED nanoscopy reveals the ubiquity of subcortical cytoskeleton periodicity in living neurons. Cell Rep. 10, 1246-1251.
- Wang Y.L. et al. 1982. Mobility of cytoplasmic and membrane-associated actin in living cells. Proc. Natl. Acad. Sci. U.S.A. 79, 4660–4664.
- Wang Y.L. and Taylor DL. 1979. Distribution of fluorescently labeled actin in living sea urchin eggs during early development. J. Cell Biol. 81, 672-9.
- Barak L. et al. 1980. Fluorescence staining of the actin cytoskeleton in living cells with 7-nitrobenz-2-oxa-1,3-diazole-phallacidin. 1980. Proc. Natl. Acad. Sci. U.S.A. 77, 980-984.
- Huang Z.J. et al. 1992. Phallotoxin and actin binding assay by fluorescence enhancement. Anal. Biochem. 200, 199-204.
- Doyle T. and Botstein D. 1996. Movement of yeast cortical actin cytoskeleton visualized in vivo. Proc. Natl. Acad. Sci. U.S.A. 93, 3886-91.
- Westphal M. 1997. Microfilament dynamics during cell movement and chemotaxis monitored using a GFP-actin fusion protein. Curr. Biol. 7, 176-83.
- Riedl J. et al. 2008. Lifeact: a versatile marker to visualize F-actin. Nat. Methods. 5, 605.
- Pang K.M. et al. 1998. Use of a fusion protein between GFP and an actin-binding domain to visualize transient filamentous-actin structures. Curr. Biol. 8, 405-408.
- Kost B. et al. 1998. A GFP-mouse talin fusion protein labels plant actin filaments in vivo and visualizes the actin cytoskeleton in growing pollen tubes. Plant J. 16, 393-401.
- Wang Y.L. et al. 1985. Exchange of actin subunits at the leading edge of living fibroblasts: Possible role of treadmilling. J. Cell Biol. 101, 597-602.