Protein Acetylation Protocols Background Information
Acetylation of proteins can occur as a co-translational or post-translational modification (PTM) (1). Co-translational acetylation occurs at the N-terminus of approximately 85% of mammalian proteins, is irreversible, and is thought to be important in protein stability, localization, and synthesis (1). Post-translational acetylation occurs on the epsilon amino group of lysine residues as a reversible and highly dynamic PTM that is known to be a key regulator in multiple cellular events, including chromatin structure, transcription, metabolism, signal transduction, and cytoskeletal regulation (2-3). To date, over 4,000 proteins have been identified as targets for PTM acetylation which is comparable to phosphorylation in cellular prevalence (3). By using the protocols below anti-acetyl lysine can be used to detect and measure acetylated proteins involved in signal transduction pathways. Acetyl lysine protocols are useful to detect and measure tubulin, histone, histone1, PVDF membrane, PVDF probing, histone2, histone 3, histone4a, histone 4b. acetylated protein analysis, WB , IP, ChIP, IF, acetylated protein, p53, sirtuin, hdac1
Product Citations for Anti-acetyl lysine monoclonal antibody (Cat. AAC01) (since 2015 introduction):
LaBarge et al. 2015. p300 is not required for metabolic adaptation to endurance exercise training. The FASEB Journal article doi: 10.1096/fj.15-281741.
, hdac2, hdac3, hdac3, hdac4, hdac5, hdac6, hdac, histone de-acetylase, tat, tubulin acetyl transferase, histone acetyl transferase, acetyl transferase.
References
1 Bogdan P. and Sherman F. 2002. The diversity of acetylated proteins. Genome Biol. 3 (5): reviews 0006.
2 Lundby A. et al. 2012. Proteomic analysis of lysine acetylation sites in rat tissues reveals organ specificity and cellular patterns. Cell Reports 2:419-431.
3 Sadoul K. et al. 2010. The tale of protein lysine acetylation in the cytoplasm. J. Biomed. Biotech. 2011:1-15. 4 Golemis EA et. Al, Protein-Protein Interactions, CSHLP, 2005, p67.
Western Blot (WB) Applications*
Use as indicated below at 1:500-1:1000 dilution, sufficient for 100-200 ml of working strength Ab.
- Run protein samples and control samples in SDS-PAGE.
- We recommend running 20 µg of TSA-treated A431 cell lysate as a control.
- Equilibrate the gel in Western blot buffer (25 mM Tris pH 8.3, 192 mM glycine, and 15% methanol) for 15 min at room temperature prior to electro-blotting.
- Transfer the protein to a PVDF membrane for 60 min at 75 V.
- Wash the membrane with TBST for 10 min. with constatnt agitation (10 mM Tris-HCl pH 8.0, 150 mM NaCl, 0.05% Tween 20).
- Air dry the membrane at room temperature for 30 min.
- Rehydrate the membrane in TBST for 30 min. at room temperature.
- The membrane may be left in TBST overnight at 4°C if convenient.
- Block the membrane surface with 5% nonfat-dry milk in TBST for 30 min at room temperature with constant agitation.
- Incubate the membrane with a 1:500-1:1000 dilution of anti-acetyl lysine antibody (Cat. # AAC01), diluted in TBST, for 1-2 h at room temperature or overnight at 4°C with constant agitation.
- Rinse the membrane three times in 50 ml TBST for 10 min. each at room temperature with constant agitation.
- Incubate the membrane with an appropriate dilution (e.g., 1:20,000) of anti-mouse secondary antibody (e.g., goat anti-mouse HRP conjugated IgG from Jackson Labs., Cat. # 115-035-068) in TBST/0.5% non-fat milk for 60 min at room temperature with constant agitation.
- Wash the membrane 5 times in TBST for 10 min each with constant agitation.
- Use an enhanced chemiluminescence detection method to detect the signal (e.g., SuperSignal West Dura Extended Duration Substrate; ThermoFisher).
NOTE: This Ab has some cross reactivity with the dyes used for pre-stained molecular weight markers. This does not affect protein specificity for acetyl groups (see Fig. 1B -1C). Also, some molecular weight marker proteins are acetylated, particularly commonly used metabolic enzymes such as glutamic dehydrogenase (m.wt. approx. 55kDa).
Figure 1: Western blot applications
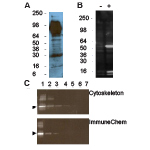
Legend: AAC01 was used at a 1:500 dilution following the recommended Western blot protocol (see below). Figure 1A: murine tissue extract, 30 g liver extract. Figure 1B: 20 g of A431 cell lysate treated with TSA (+) or untreated (-). Strongly enhanced bands at 55 and 14-16 kDa in TSA-treated lysate correspond to acetylated tubulin and histone proteins, respectively. Figure 1C: Titration of acetylated BSA lanes 1-5 contain 0.5, 0.1, 0.05, 0.01, and 0.005 ng Ac-BSA, lanes 6-7 contain 500 and 1000 ng non-acetylated BSA, respectively. AAC01 recognizes 0.005 ng of chemi-cally acetylated BSA. For comparison ImmuneChem anti-acetyl lysine antibody Cat# ICP0380 was able to detect 0.05 ng of acetylated BSA when used as instructed by manufacturer. Arrow-head indicates acetylated BSA, higher molecular weight bands are acetylated BSA oligomers.
Immunoprecipitation (IP) Applications*
Use as indicated at 20 µl per IP reaction (1.5 mg total lysate per IP), sufficient for approximately 10 IP assays.
- Add 20 µl of acetyl lysine antibody (Cat. # AAC01) to 500 µl of PBS pH 7.4 in a microfuge tube containing 30 µl of packed Protein G agarose pre-equilibrated in PBS.
- Gently rotate the reaction for 1 h at 4°C.
- Add 500 ml of PBST to the mixture and centrifuge for 1 min at 4°C and 3000 rpm (approx. 960 x g). Addition of the PBST will prevent agarose from sticking to the microfuge tube walls.
- Discard supernatant and wash beads 3X in PBST.
- Add 1-1.5 mg of cell lysate (1-1.5 mg/ml protein concentration) to the beads. The lysate must be prepared in an IP compatible buffer. In this assay, the IP protein is in the following buffer: 50 mM Tris pH 7.5, 150 mM NaCl, 1% IGEPAL, 0.05% SDS, 0.25% Na deoxycholate).
- Gently rotate the reaction at 4°C for 2 h or overnight if convenient.
- Spin down agarose for 1 min at 4°C at 3000 rpm (approx. 960 x g).
- Discard supernatant and wash beads with 700 µl of PBST at 4°C.
- Repeat wash two more times.
- Resuspend beads in 30 µl of 2X Laemmli buffer (125 mM Tris pH 6.8, 20% glycerol, 4% SDS, 0.005% Bromophenol blue, 5% beta-mercaptoethanol) and boil for 5 min prior to loading on SDS-PAGE for subsequent Western blot analysis.
Figure 2: IP of histone proteins from TSA-treated A431 cells
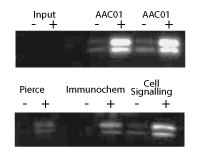
Legend: A431 cells were either treated (+) or untreated (-) with TSA (0.6 mM for 6 h). Cell lysates were prepared in a modified RIPA buffer (50 mM Tris pH 7.5, 150 mM NaCl, 1% IGEPAL, 0.1% SDS, 0.5% Na deoxycholate) and 1.5 mg of lysate per reaction was used for IP of acetylated histones. Each IP was performed according to the manufacturer’s instructions. IP reactions for AAC01 are shown in duplicate. Western blots of immunoprecipitated proteins were developed using AAC01 at 1:500 dilution. Input signal is from 15 mg of TSA treated (+) or untreated (-) A431 lysates. Ability of AAC01 to IP histones was compared to other commercially available antibodies, ThermoFisher (Pierce) Cat. # MA1-2021, ImmuneChem Cat. # ICP0388 and Cell Signaling Cat. # 9441. IPs were carried out according to the manufacturer’s instructions.
Immunofluorescence (IF) Applications*
Use as indicated below at 1:200 dilution, sufficient for 40 ml of working strength Ab, approx. 400 IF slides.
IF Method (TSA treatment of A431 cells)
- Plate A431 cells at 1 x 10⁵/ml on acid washed coverslips in tissue culture dish with DMEM media containing 10% FBS.
- Allow cells to grow for 24-48 h, then treat one set of coverslips with TSA (5 mM for 16 h).
- Fix cells by dipping coverslips in –20°C methanol for 5 min (it is convenient to use a porcelain coverslip rack for fixing and rinsing samples).
- Remove coverslips and dip into –20°C acetone for 2 min.
- Air dry the coverslips. Dip the coverslips into PBS for 5 min. at room temperature.
- Place coverslips cell side up on parafilm and apply 150 µl of anti-acetyl lysine antibody (Cat. # AAC01) solution to each coverslip (5 µl per 1ml PBS plus 3% w/v BSA).
- Incubate at room temperature for 30 min.
- Dip the coverslips into PBS for 5 min. at room temperature.
- Apply 100 µl-200 µl of fluorescently-labeled anti-mouse secondary antibody at manufacturer’s recommended dilution. For example, we use fluorescently-labeled goat anti-mouse at 1:200 dilution in PBS.
- Incubate at room temperature for 30 min.
- Dip the coverslips into PBS for 5 min. at room temperature.
- Rinse coverslips for 30 seconds in sterile water.
- Dip coverslips in absolute ethanol at room temperature for 2 min and transfer to blotting paper, cell side up, allow to air dry.
- Place coverslips, cell side down, on glass slide with mounting media (e.g., EMS, Cat# 17987-10) and observe cells under fluorescence microscope.
Figure 3: IF of A431cells untreated and treated with TSA
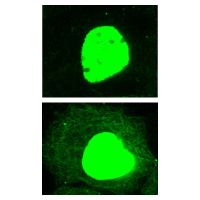
Legend: Human epidermoid carcinoma A431 cells, untreated (left) or treated (right) with TSA (5 µM for 16 h), were stained as described in the method. Acetylated cytoplasmic and nuclear proteins were visualized in green fluorescence. Note that in contrast with the untreated control, acetylated microtubule network is clearly visible in TSA-treated sample. The fluorescent nuclear intensities indicate the high abundance of acetylated proteins in the nucleus.
Chromatin Immunoprecipitation (ChIP) Application*
Use as indicated below at 1:100 dilution, sufficient for 200 ChIP assays of 100 µl volume.
- Sheared and cross-linked chromatin from A431 cells was prepared according to published protocols (4).
- Approximately 25 µg of chromatin is used per ChIP assay and the reactions are carried out in the following ChIP buffer: 10 mM Tris pH 8.0, 0.5 mM EGTA, 1 mM EDTA, 140 mM NaCl,1% Triton, 0.15% SDS, 0.1% Na deoxycholate, 1 mM PMSF, 2 µg/ml pepstatin/leupeptin, and aprotinin.
- Make the final volume to 100 µl in ChIP reaction buffer and add 1 ml of anti-acetyl lysine antibody (Cat. # AAC01) per ChIP assay. NOTE: it is also recommended to run mouse IgG (5 µg) as a non-specific control reaction (see Ctr IgG lanes above) and a no-antibody as input control (see Input lanes above).
- Incubate on a rotator at 4°C for 1-2 h or overnight.
- Add 20 µl of a 50% slurry of Protein G beads to all reactions and rotate at 4°C for 2-4 h.
- Pellet beads by centrifugation at 3000 rpm (approx. 960 x g) for 1 min.
- Transfer the no-antibody control supernatant to a fresh tube on ice, this will be processed later and serve as the total input control.
- Discard all other supernatants.
- Wash beads five times with 500 µl of RIPA buffer (10 mM Tris pH 8.0, 0.5 mM EGTA, 1 mM EDTA, 140 mM NaCl,1% Triton, 0.1% SDS, 0/1% Na deoxycholate, and 1 mM PMSF).
- Wash beads once with 500 µl of LiCl buffer (0.25 M LiCl, 0.5% NP-40, 0.5% Na deoxycholate, 1 mM EDTA, 10 mM Tris pH 8.0).
- Wash beads once with 500 µl of TE buffer (10 mM Tris pH 8.0, 1 mM EDTA) and resuspend beads in 100 µl of TE buffer.
- The immunoprecipitated chromatins bound to the bead samples (and chromatins in the no-antibody control supernatant) were processed for DNA isolation and PCR analysis according to published protocols (4).
Figure 4: ChIP analysis with AAC01 antibody
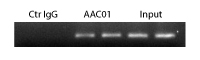
Legend: Chromatin was prepared from A431 cells, either untreated or TSA-treated (5 mM, 4 hrs). ChIP was performed according to method see below. Ctr IgG: mouse IgG used for ChIP, AAC01: anti-acetyl antibody used for ChIP, Input: cell lysate prior to ChIP. PCR analysis was carried out using primers for the promoter region of the housekeeping gene GAPDH.
Additional Links:
Overview of PTM Detection Techniques and Methods
References
- Bogdan P. and Sherman F. 2002. The diversity of acetylated proteins. Genome Biol. 3 (5): reviews 0006.
- Lundby A. et al. 2012. Proteomic analysis of lysine acetylation sites in rat tissues reveals organ specificity and cellular patterns. Cell Reports 2:419-431.
- Sadoul K. et al. 2010. The tale of protein lysine acetylation in the cytoplasm. J. Biomed. Biotech. 2011:1-15.
- Golemis EA et. Al, Protein-Protein Interactions, CSHLP, 2005, p67.