A Method to Examine Temporal Regulation of Endogenous PTMs on Any Protein of Interest: A Snapshot of the EGFR Signaling Pathway
Henrick Horita, Andy Law, Soonjin Hong, and Kim Middleton
American Society for Cell Biology, 2016, Poster B1120
Cytoskeleton Inc., Denver, CO 80223
Table of Contents
Introduction
Characterization of PTM profiles for proteins such as p53, EGFR, protein kinase C, tubulin, Tau, and histones have clearly demonstrated the essential requirement for multiple, dynamic PTMs in regulating protein function and orchestrating cellular events. In many cases protein modifications have been shown to work in concert to orchestrate a specific protein function, and recent studies have suggested that both cooperative and negative PTM crosstalk is a pervasive and fundamental cell regulatory mechanism. Accordingly, there is significant interest in not only characterizing individual PTMs on a protein of interest (POI) but also in characterizing the temporal regulation and interplay of multiple PTMs on a given protein target and within a given signal transduction pathway.
Tools to examine endogenous PTM changes in an unbiased manner are being developed in the proteomics arena utilizing a variety of powerful mass spectrometry approaches. While these approaches are generating exciting and insightful data regarding PTM profiles there are currently several significant technical and biological challenges, one of which is that cell and molecular biologists do not have the expertise to analyze these enormous data sets de novo, nor do they have the tools to easily validate these results without biasing themselves to focusing on a POI; thus, the benefits of generating these unbiased datasets are diminished. We designed a methodology that would better utilize the unprejudiced potential from these large datasets by allowing users to take an unbiased snapshot of the PTM profile of any POI, which would be beneficial for several reasons: 1) validate PTM profile of a POI without having specialized tools (i.e. PTM specific antibody for POI), 2) validate PTM profiles of multiple POIs within a given study, 3) Identify the PTM profile of stylelow abundance proteins that are unlikely to be detected by current proteomic analysis, and 4) utilize this methodology for downstream biological/functional experiments.
The epidermal growth factor (EGF) pathway is one of the best characterized signal transduction pathways and is known to be regulated by a multitude of PTM events. Importantly, the protein modification profile for several of the proteins in the EGFR signaling cascade are well characterized, and a recent proteomic study investigated the relationship between phosphorylation, ubiquitination, and protein-protein interaction in response to multiple EGFR stimulants. This study was informative, but its value could be enhanced by having a set of tools to validate a particular signaling axis within that vast array of changes. For example, to our knowledge no studies have been performed to validate changes in the PTM profile of an established EGF/EGFR pathway, like the EGFR – rat sarcoma (RAS) - c-Fos axis, in a single comprehensive study. Currently, obtaining a comprehensive PTM profile of a signaling pathway like the EGFR- RAS- c-Fos axis in response to a physiologic stimulant would be very challenging using the existing set of available tools.
Method
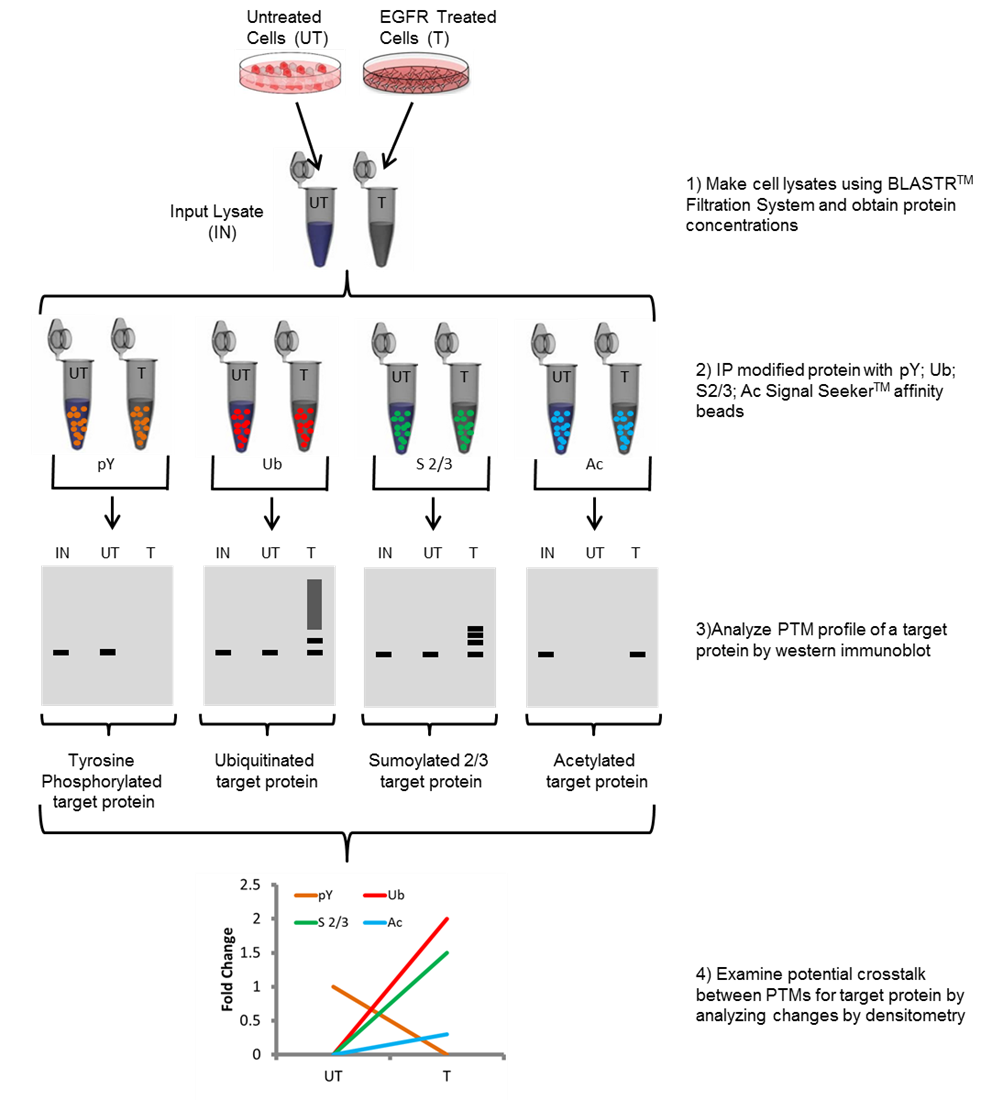
Figure 1. Workflow of Signal-Seeker PTM identification kit.
Diagram depicting steps performed in order to obtain tyrosine phosphorylation (pY), ubiquitination (Ub), Sumoylation 2/3 (Sumo 2/3), and acetylation (Ac) PTM profiles for a protein of interest.
Results
Figure 2. Rapid detection of all four PTMs for any target protein of interest: Focus on EGFR.
(A). Serum restricted A431 cells were either unstimulated or stimulated with EGF for five minutes prior to lyses with BlastR lysis buffer. Whole cell lysate (WCL) was analyzed for EGFR levels (lanes 1,2). Ubiquitin control beads (Cat. # CUB02) were used to immunoprecipitate non-specific binding proteins (lanes 3,4). Ubiquitin binding beads (Cat. # UBA01-beads) were used to immunoprecipitate ubiquitinated proteins (lanes 5,6). Acetyl lysine binding beads (Cat. # AAC01) were used to immunoprecipitate acetylated proteins (lanes 7,8). Phospho-tyrosine binding beads (Cat. # APY03) were used to immunoprecipitate tyrosine phosphorylated proteins (lanes 9,10). Sumo 2/3 binding beads (ASM24) were used to immunoprecipitate sumoylated 2/3 proteins (lanes 11, 12). IgG binding control beads were used to immunoprecipitate non-specific binding proteins (lanes 13,14). All samples were separated by SDS-PAGE and analyzed by western immunoblotting using an EGFR antibody to identify changes in EGFR post-translational modifications in response to EGF.
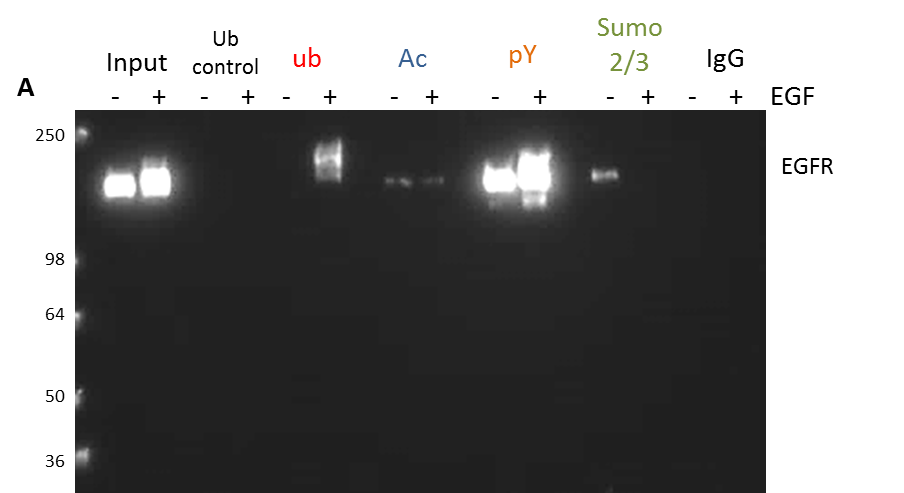
Figure 3. Characterize target PTMs for a set of proteins of interest in any signaling pathway: Focus on ubiquitination.
Serum restricted A431 cells were either unstimulated or stimulated with EGF for five minutes or 1 hour prior to lyses with BlastR lysis buffer. Samples were immunoprecipitated with ubiquitin control beads (Cat. # CUB02) or ubiquitin binding beads (Cat. # UBA01-beads). Samples were separated by SDS-PAGE and analyzed by western blot for (A) EGFR, (B) Ras, and (C) cFos to identify the ubiquitinated species for these proteins in the EGFR signaling pathway.
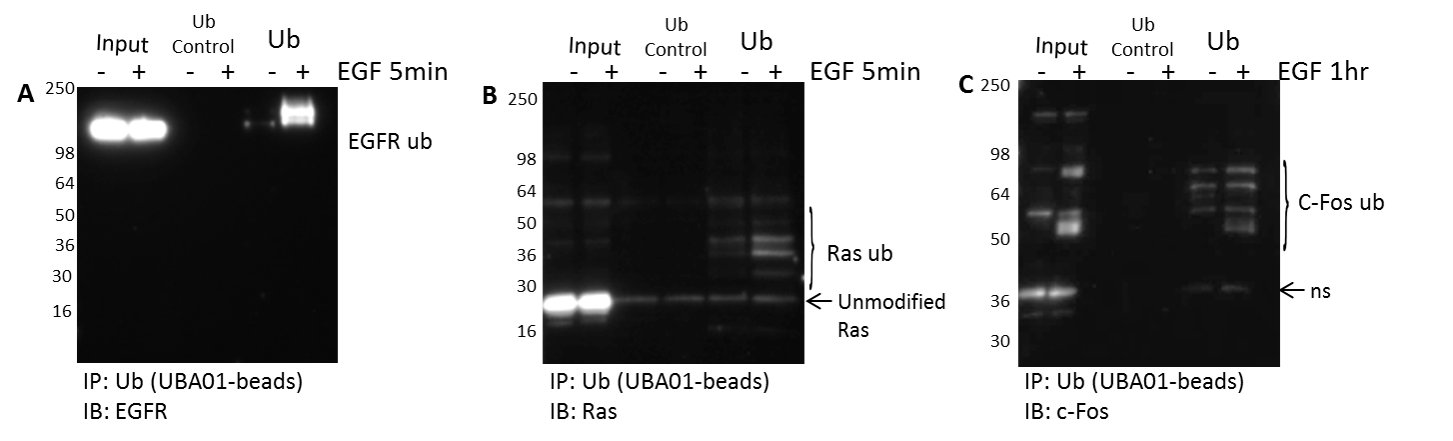
Figure 4. Detect endogenous, temporal changes of a PTM for any target protein in response to a physiologic stimulant: Focus on Ras ubiquitination.
(A) Serum restricted A431 cells were stimulated with EGF for the given time period. WCL was analyzed for RAS levels. Tubulin was used as a loading control. (B) Unstimulated and EGF treated A431 lysates were incubated with ubiquitin binding beads (Cat. # UBA01-beads) to immunoprecipitate ubiquitinated proteins. Samples were separated by SDS-PAGE and analyzed by western immunoblotting using a Ras antibody to identify ubiquitinated Ras. Shown are representative westerns from N≥3 independent experiments. (C) Quantification of densitometric analysis of endogenous ubiquitinated Ras identify dynamic changes in response to EGF stimulation.
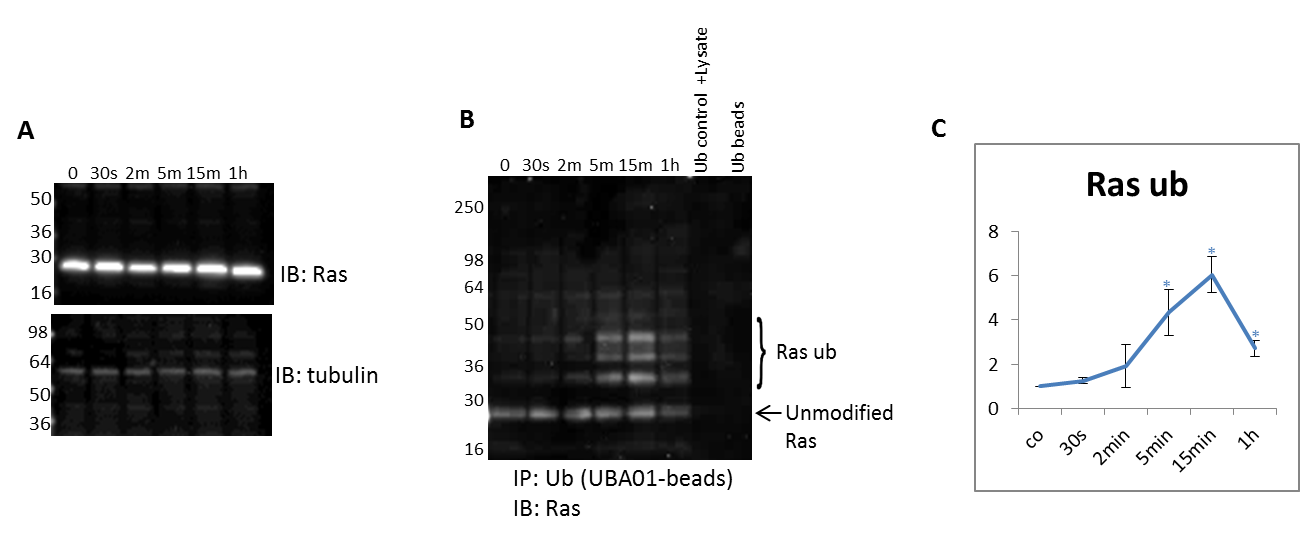
Figure 5. Detect endogenous changes of all four PTMs for any target protein to identify potential PTM crosstalk: Focus on dynamic EGFR PTM modifications.
(A) Serum restricted A431 cells were stimulated with EGF for the given time period. WCL was analyzed for EGFR levels. Tubulin was used as a loading control. Unstimulated and EGF treated A431 lysates were incubated with (B) Cat. # APY03-beads to immunoprecipitate tyrosine phosphorylated proteins and analyzed for tyrosine phosphorylated EGFR, (C) Cat. # UBA01-beads to capture ubiquitinated proteins and analyzed for ubiquitinated EGFR, (D) AAC01-beads to immunoprecipitate acetylated proteins and analyzed for acetylated EGFR, (E) and ASM24-beads to immunoprecipitate sumoylated 2/3 proteins and analyzed for sumoylated 2/3 EGFR; shown are representative westerns from N≥3 independent experiments. (F) Quantification of densitometric analysis of EGFR PTMs.
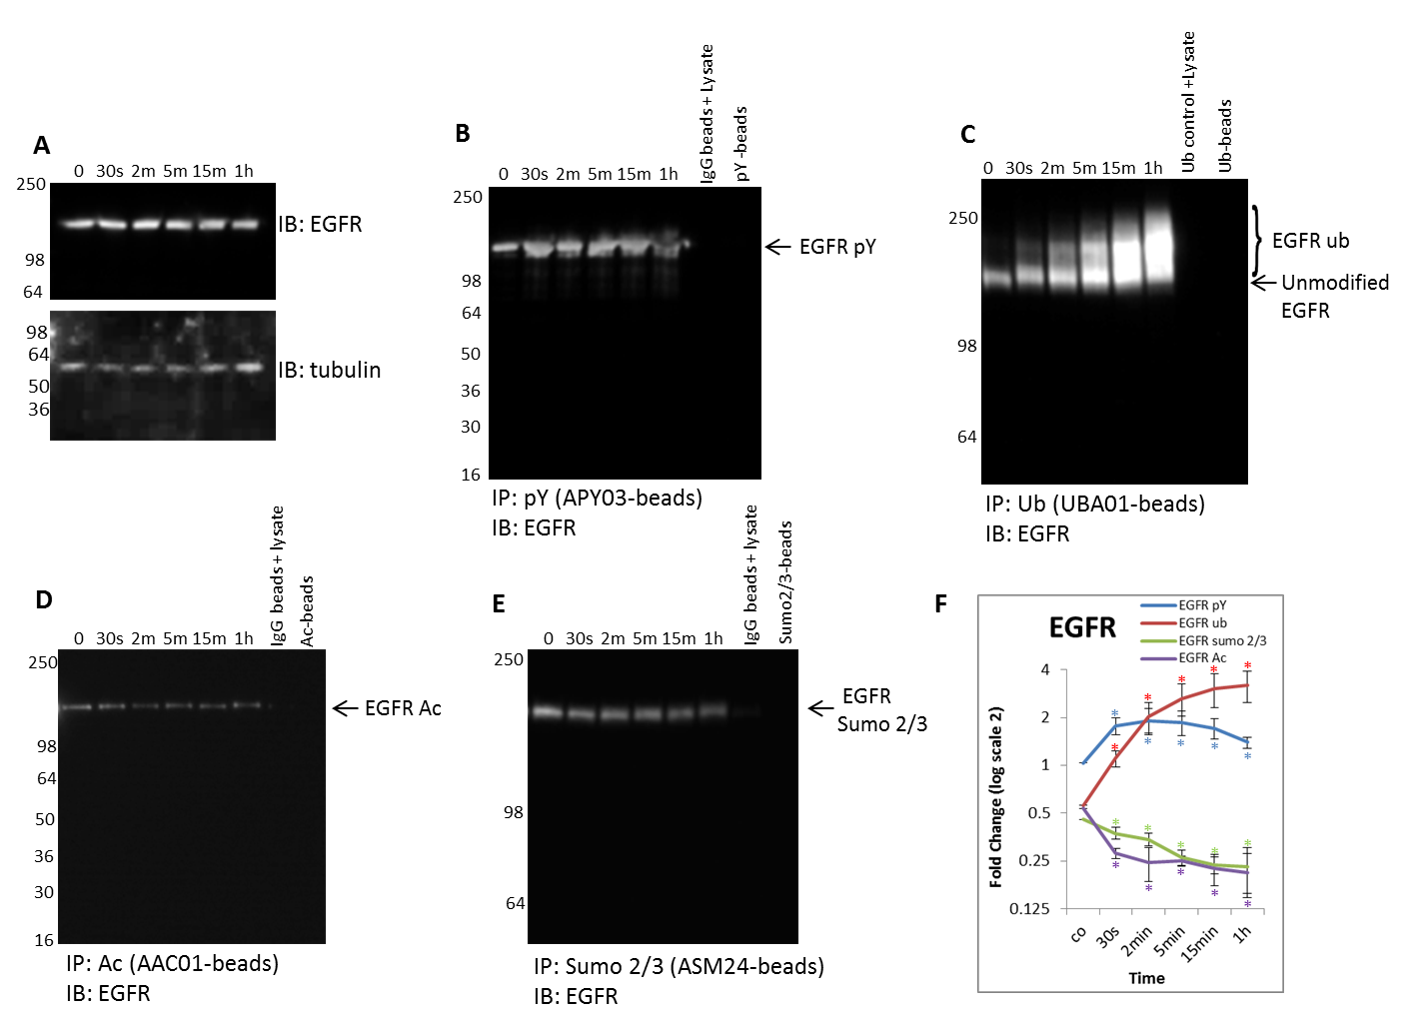
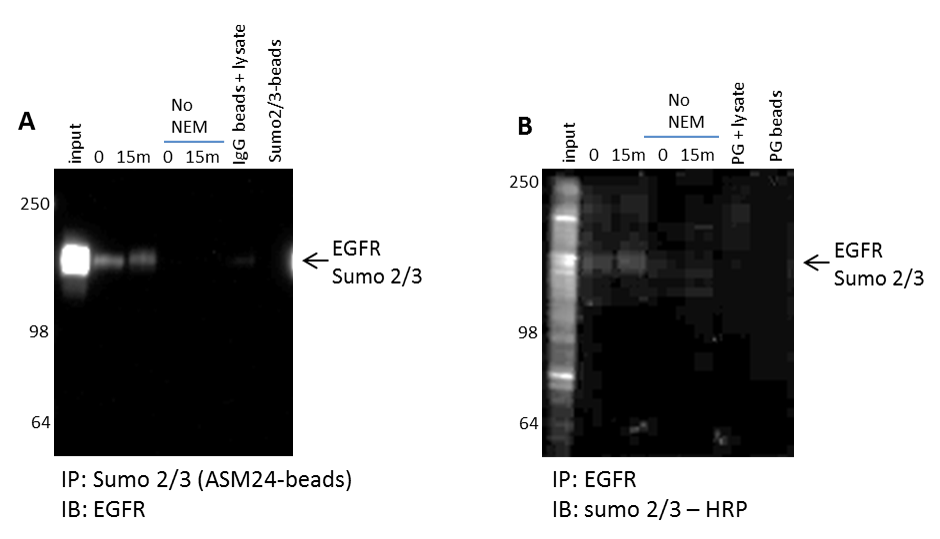
Figure 6. Identify and validate uncharacterized PTMs for any target protein.
(A) A431 cells were harvested with BlastR lysis buffer with or without NEM. Lysates were incubated with ASM24-beads and analyzed for sumoylated 2/3 EGFR. (B) Lysates with or without NEM were incubated with EGFR antibody and analyzed for sumoylated 2/3 EGFR with sumoylated 2/3-HRP antibody; shown are representative westerns from N≥3 independent experiments.
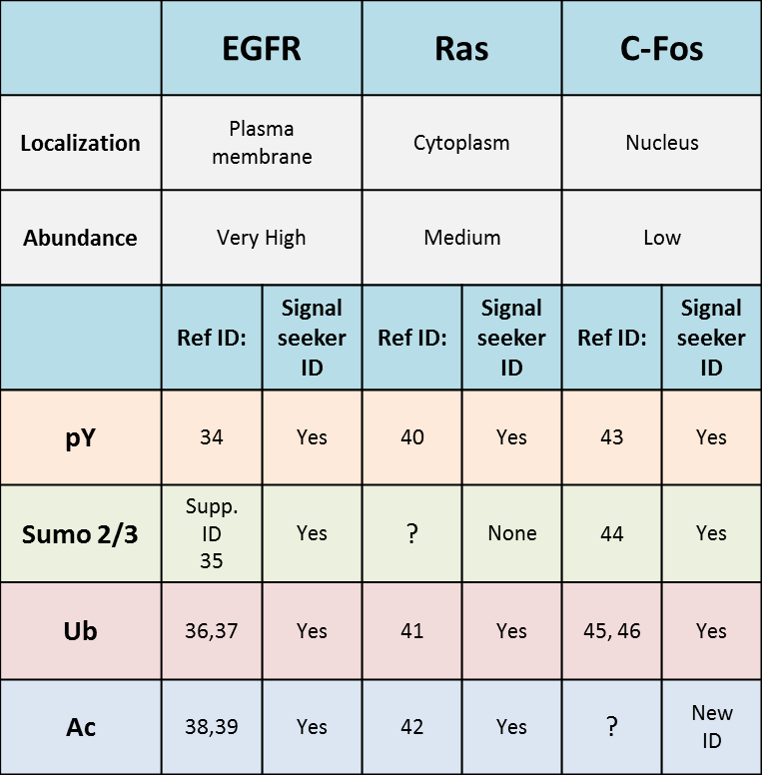
1. Signal seeker tools effectively identified all 10 previously studied PTMs of EGFR, Ras, and cFos, and also identified a novel modification of cFos
2. Useful tool to rapidly investigate all 4 PTMs for any protein of interest
3. Useful method to investigate changes in a target PTM for multiple proteins of interest
4. Study endogenous, dynamic PTM changes for any protein of interest
5. Study proteins from low to high abundance and from all cellular departments.
References
34. Downward J, Parker P, Waterfield MD. Autophosphorylation sites on the epidermal growth factor receptor. Nature. 1984;311(5985):483-5.
35. Levkowitz G, Waterman H, Zamir E, Kam Z, Oved S, Langdon WY, et al. c-Cbl/Sli-1 regulates endocytic sorting and ubiquitination of the EGFR. Genes Dev. 1998;12(23):3663-74.
36. Stang E, Johannessen LE, Knardal SL, Madshus IH. Polyubiquitination of the EGFR occurs at the plasma membrane upon ligand-induced activation. J Biol Chem. 2000;275(18):13940-7.
37. Song H, Li CW, Labaff AM, Lim SO, Li LY, Kan SF, et al. Acetylation of EGFR contributes to tumor cell resistance to HDAC inhibitors. Biochem Biophys Res Commun. 2011;404(1):68-73.
38. Packham S, Lin Y, Zhao Z, Warsito D, Rutishauser D, Larsson O. The Nucleus-Localized Epidermal Growth Factor Receptor Is SUMOylated. Biochemistry. 2015;54(33):5157-66.
39. Bunda S, Heir P, Srikumar T, Cook JD, Burrell K, Kano Y, et al. Src promotes GTPase activity of Ras via tyrosine 32 phosphorylation. Proc Natl Acad Sci U S A. 2014;111(36):E3785-94.
40. Yang MH, Nickerson S, Kim ET, Liot C, Laurent G, Spang R, et al. Regulation of RAS oncogenicity by acetylation. Proc Natl Acad Sci U S A. 2012;109(27):10843-8.
44. Jura N, Scotto-Lavino E, Sobczyk A, Bar-Sagi D. Differential modification of Ras proteins by ubiquitination. Mol Cell. 2006;21(5):679-87.
45. Bossis G, Malnou CE, Farras R, Andermarcher E, Hipskind R, Rodriguez M, et al. Down-regulation of c-Fos/c-Jun AP-1 dimer activity by sumoylation. Mol Cell Biol. 2005;25(16):6964-79.
46. Bossis G, Ferrara P, Acquaviva C, Jariel-Encontre I, Piechaczyk M. c-Fos proto-oncoprotein is degraded by the proteasome independently of its own ubiquitinylation in vivo. Mol Cell Biol. 2003;23(20):7425-36.
47. Stancovski I, Gonen H, Orian A, Schwartz AL, Ciechanover A. Degradation of the proto-oncogene product c-Fos by the ubiquitin proteolytic system in vivo and in vitro: identification and characterization of the conjugating enzymes. Mol Cell Biol. 1995;15(12):7106-16.
48. Portal MM, Ferrero GO, Caputto BL. N-Terminal c-Fos tyrosine phosphorylation regulates c-Fos/ER association and c-Fos-dependent phospholipid synthesis activation. Oncogene. 2007;26(24):3551-8.
Products Used
Phosphotyrosine Antibody Mouse Monoclonal S7B10 (Cat. # APY03)
Rac1 Pulldown Activation Assay Kit (Cat. # BK035)
Anti-Phosphotyrosine Affinity Beads (Cat. # APY03-beads
BlastR Rapid Lysate Prep Kit (Cat. # BLR01)
BlastR Rapid Filtration Kit (Cat. # BLR02)
Ubiquitination Affinity Beads (Cat. # UBA01-beads)
Acetyl Lysine Antibody Mouse Monoclonal (Cat. # AAC01)
Phosphotyrosine Antibody Mouse Monoclonal 27B10 (Cat. # APY03)
Anti-Phosphotyrosine Affinity Beads (Cat. # APY03-beads)
Anti-Acetyl Lysine Affinity Beads (Cat. # AAC01-beads)
SUMO-2/3 Affinity Beads (Cat. # ASM24-beads)