As an integral component of a cell’s cytoskeleton and one of the most abundantly expressed proteins in cells, actin is involved in multiple physiological functions, including intracellular transport, cell growth, morphology, motility, trafficking, polarity, cell-to-cell contacts, and cytokinesis. These basic functions require remodeling of the actin cytoskeleton, as well as extension and withdrawal of actin-based cellular neurites (e.g., lamellipodia, filopodia), all of which rely upon rapid dynamic cycling between filamentous actin (F-actin) and monomer actin (G-actin)1,2. Correspondingly, dysfunctional actin cytoskeletal dynamics are a pathophysiological feature of many human diseases, including those with oncogenic, neurodegenerative, or cardiovascular origins3-9. For these reasons, pre-clinical and clinical scientists have a great interest in imaging the actin cytoskeleton of many different types of cells, and of particular relevance is live cell imaging of in vitro cell cultures representing both healthy and disease states.
The ideal actin visualization tool is a small molecule able to bind F-actin in a sensitive and selective manner, while not disrupting actin re-modeling (the cycling between filaments and monomers). In addition, introduction directly into the cell culture medium or tissues without need for transfection or electroporation is advantageous10-13. With any F-actin probes used in living cells, a major concern is how inclusive the probes are for all F-actin-based structures. In other words, a differential, selective labeling of F-actin in different actin-based structures (e.g., filopodia versus stress fibers) must be avoided10-13. This concern is valid as a recent study of GFP-actin, F-tractin, Lifeact, and utrophin (UtrCH) F-actin probes in living cells found that these actin-binding probes under-represented F-actin in filopodial regions, while GFP-actin displayed the opposite pattern. However, GFP-actin weakly labeled F-actin-based stress fibers and lamellae10,11. Impediments to probe binding include steric hindrance from actin-binding proteins10,14,15, too large of fluorescent tag (e.g, GFP, F-tractin) that can prohibit incorporation into the growing filament10, high fluorescence background signal due to G-actin binding10,16,17, and concentration-dependent effects on actin dynamics that complicate data interpretation since the labeling probe itself can modify actin dynamics (e.g., Lifeact in cell nuclei, Utr230 in nuclei and cytoplasm)10,18-20. Notably, the new SiR/SPY actin probes fulfill the needs of an “ideal” actin-binding molecule while surmounting most, if not all, of the concerns and shortcomings associated with existing actin probes. Below is a brief review of the most commonly used F-actin live cell imaging probes.


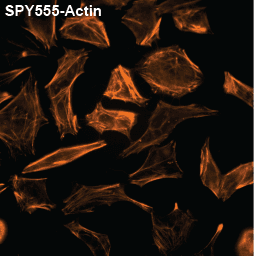
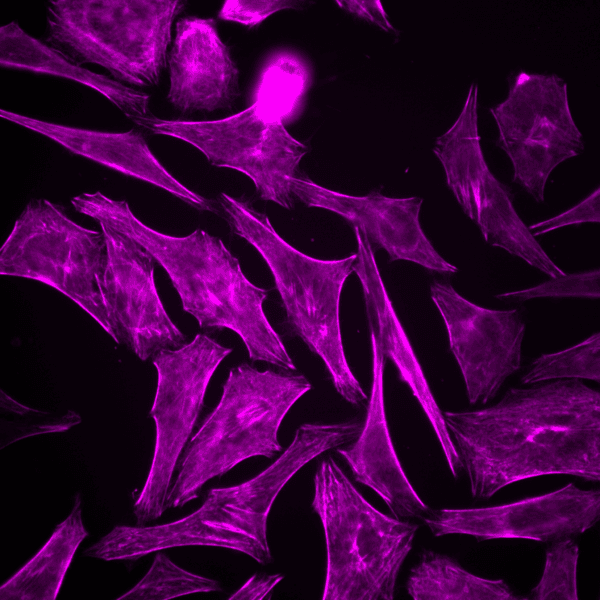
SiR and SPY Actin Probes
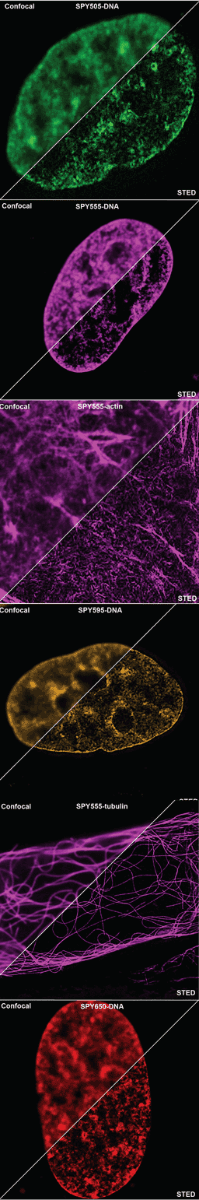
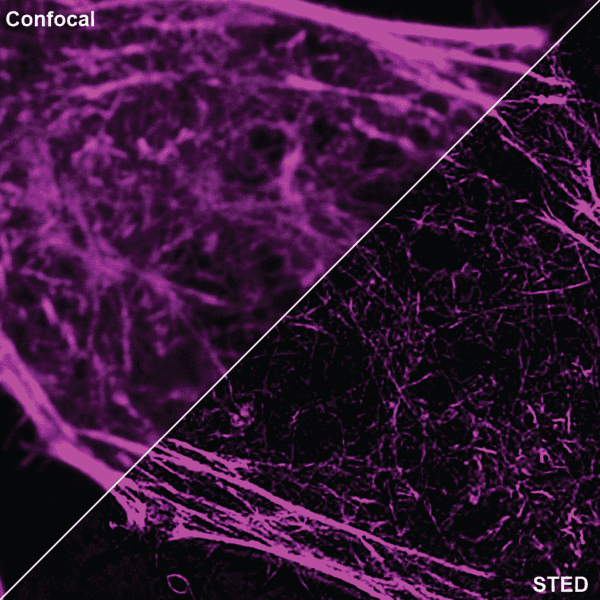
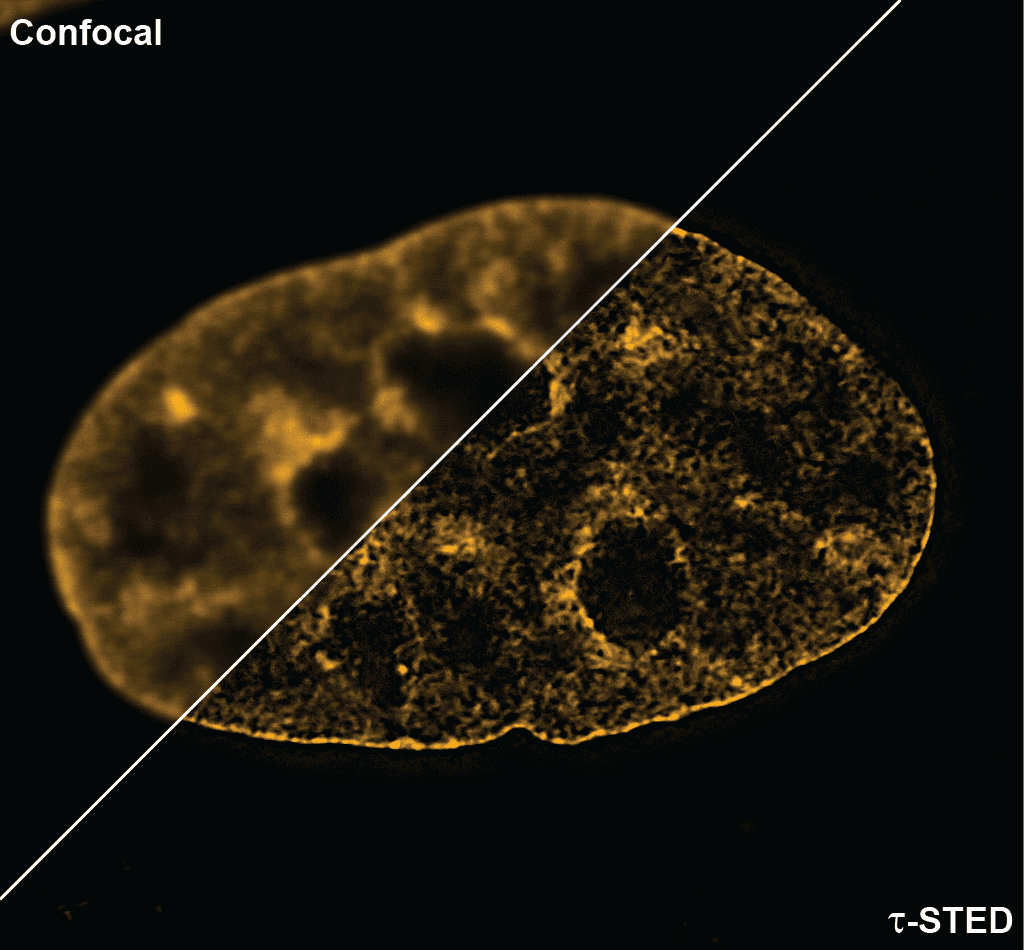
Initially characterized by Lukinavicius et al.12,13 and introduced commercially in 2014, the SiR and SiR700-actin live cell imaging probes are arguably the easiest-to-use F-actin probes. These probes label endogenous F-actin and avoid the need for transfections and over-expression of labeled actin proteins or actin-binding proteins12,13. SiR/SiR700-actin probes are structurally related to the naturally-occurring F-actin binding molecule jasplakinolide12,13,21. These F-actin probes utilize the proprietary fluorophore silicon rhodamine (SiR), a bright, photostable far-red dye with little, if any, background signal. The low background is because the SiR probes exist in a closed, non-fluorescent state (spirolactone), meaning that the probes are self-quenching when unbound to F-actin12,13. SiR is compatible with most microscopes as it can be visualized with standard Cy5 settings (optimal excitation, 650 nm; emission, 670 nm) which confer compatibility with a wide range of genetically-encoded reporter fluorophores (e.g., GFP, m-Cherry)12,13. SPY555-actin is the newest addition to Spirochrome’s family of F-actin live cell imaging probes. SPY555-actin is an improved version of the SiR-actin probes as a lower concentration can be used which offers robust labeling and reduced cytotoxicity and perturbation of actin cytoskeletal dynamics. SPY555-actin is imaged with a standard TMR or Cy3 channel (optimal excitation, 555 nm; emission, 580 nm) using the same staining protocol as for SiR/SiR700-actins (the recommended staining protocol is 100 nM for 2 hours). The key features of SiR and SPY actin probes are their cell permeability, fluorogenic character, minimal cytotoxicity, photostability, and compatibility with both standard fluorescence microscopy (e.g., wide-field, confocal) and super-resolution microscopy (e.g., STED, SIM)12,13,22-25 (Figs. 1 and 2). Notably, the combination of STED and SiR/SPY-actin probes allows for unparalleled fluorescent visualization of subcellular F-actin structures and their physical characterization in living cells21,22-25 (Fig. 2). To take advantage of super-resolution microscopy, one must be able to select with high specificity the area to be examined using fluorescent probes. The probes must be bright, photostable, exhibit no or little phototoxicity, and have excitation and emission characteristics in the far red spectrum12,13,22,25. In addition, if the probe is to be used for live cell imaging (thus avoiding fixation artifacts that occur when cells are fixed), high cell permeability is necessary12,13,22,25. SiR/SPY-actin probes fulfill all of these requirements. Like some of the other F-actin probes discussed below, SiR/SPY-actin probes can affect actin dynamics (i.e., enhance polymerization and stabilize filaments) if used at high concentrations12,13,21,23-25. Extensive characterization studies indicate that typically concentrations of <100 nM produce no affect on actin cytoskeleton remodeling; however, a one-time titration for each cell line being used is recommended to insure that SiR/SPY-actin-induced artifacts are avoided12,13.
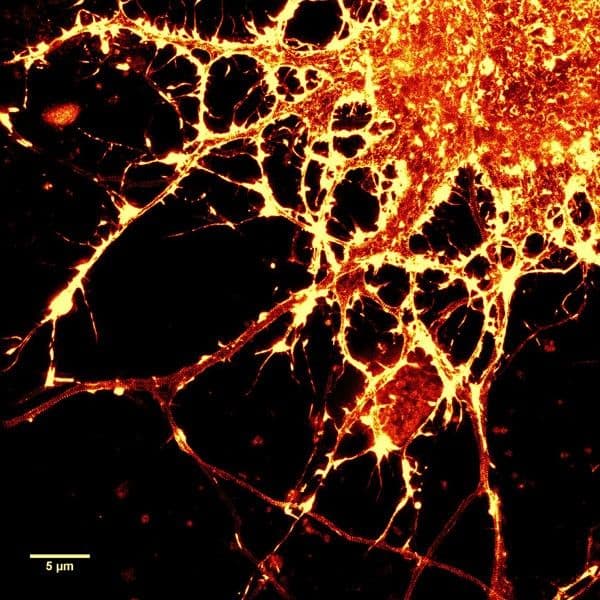
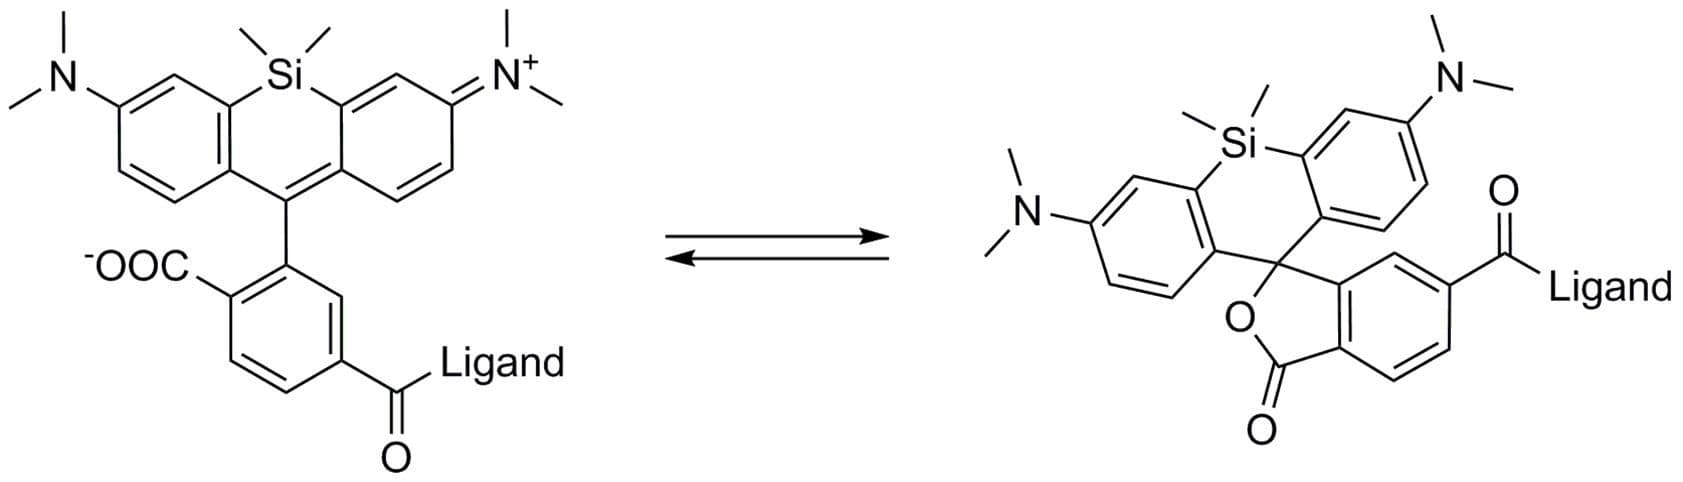
The unique biophysical properties of the SiR/SPY fluorophores are responsible for the very low background signal compared to other F-actin probes. SiR probes are excited by and emit light in the near infrared/far red spectral range, thus avoiding the use of shorter wavelengths such as blue and green light that typically autofluoresce, causing higher background signals. SiR/SPY-actin probes possess two physical states: 1. a non-fluorescent, closed off-state (spirolactone) and 2. an open, highly fluorescent on-state (zwitterion). The binding of the probe to its ligand target favors the highly fluorescent open state while the free unbound probe exists in the closed, non-fluorescent state (Fig. 3). The fluorescence amplification is 100-fold from the unbound to bound state. This results in a highly sensitive biosensor in which the majority of fluorescence occurs only in the bound state12,13. SiR-actin probes have been used to examine F-actin in tissue26 and a wide variety of cell types, including (but not limited to) human-induced pluripotent stem cell lines, cardiac cells, endothelial cells, epithelial cells, muscle cells, multiple cancer cell lines, and primary neurons12,13,21,23-25,27-29. For instance, SiR-actin was used to demonstrate the existence of the F-actin-based periodic membrane skeleton (PMS) by STED microscopy in the axons, dendrites, and nodes of Ranvier of living neurons, as well as suggest the functional responsibilities of the PMS21,23,24 (Fig. 2).
Fluorescent actin and fluorescent actin-binding domain peptides
Fluorescently-labeled actin (e.g., GFP-actin, eGFP-actin) is one of the original reagents used for studying dynamic remodeling of the actin cytoskeleton in living cells across a range of species10,11,30,31,32. It is often employed for fluorescence recovery after photobleaching (FRAP) microscopy10. Although still utilized by actin researchers, it has several drawbacks. First, the size of GFP (~28 kDa) can impair polymerization10,33, meaning that GFP-actin localization may not tell the whole story in regards to where actin re-organization is happening and to what extent, as GFP-actin is known to differentially label F-actin structures10,31. Second, some actin-binding proteins (e.g., nucleators within the formin family) might prevent incorporation of GFP-actin into actin seeds or growing polymers due to steric hindrance10,14,15. Third, as both G-actin and F-actin are labelled, there is a relatively high fluorescent background signal from non-filamentous actin34, and finally, expression of eGFP-actin can affect cell behavior10,35,36.
Another method for live cell imaging of actin is yeast- or human-derived actin binding domains fused to GFP, eGFP, or m-Cherry fluorophores10,11,19. The three most commonly used of these genetically-encoded F-actin probes are Lifeact, utrophin, and F-tractin. The best characterized is Lifeact, a 17 amino acid peptide from yeast Abp14016,17. Lifeact has been used in a variety of mammalian and non-mammalian cells for live cell imaging of the actin cytoskeleton and is considered one of the gold standards for F-actin visualization10,31. Indeed, Lifeact transgenic mice and zebrafish have been created10,17,37,38. However, Lifeact has several negative characteristics, including the possibility of affecting actin dynamics (so-called Lifeact-induced artifacts) and inhibiting the binding of actin-associated proteins such as cofilin39-41. Furthermore, Lifeact-GFP has a strong affinity for G-actin which results in a high background fluorescence signal 16. Indeed, athough it binds to F-actin with a Kd of 2.2 ± 0.3 μM, its binding affinity for G-actin is 10-fold higher than for F-actin16. Additionally, Lifeact is not a comprehensive actin marker as it does not bind all actin-containing structures10,39. Another downside is that Lifeact is introduced into the cell through transfection rather than simply adding it into the medium as is done for the SiR/SiR700/SPY probes10. In addition, at high expression levels, Lifeact can influence actin dynamics. For instance, Lifeact induces assembly of nuclear actin18. Similar to other F-actin live cell imaging reagents, titrations are necessary to select an optimal concentration that selectively and specifically labels F-actin while not affecting actin dynamics. A recent study41 illustrates the difficulty in finding a concentration of Lifeact-TagGFP2 that does not create artifacts such as reduced F-actin dynamics that affect stress fibers and the actin cytoskeleton itself, likely due to disruption of cofilin binding. These subcellular F-actin changes translated into altered cell motility. Notably, at high expression levels, Lifeact-TagGFP2 also affected the network organization of microtubules and intermediate filaments41. In the continuing search for live cell F-actin probes, Patel et al.19 screened four different Lifeact-GFP probe constructs for their ability to affect axonal and dendritic processes in primary hippocampal mouse neurons. All four Lifeact constructs affected neuron morphology in one or more of the following parameters: total axon length, length of dendrites (tree, branch, and/or shaft), and dendritic complexity19.
UtrCH is another actin binding domain live cell imaging reagent and is based on the tandem calponin homology domains (CH1 and CH2) of utrophin10,42. UtrCH consists of the first 261 amino acid residues of human utrophin, an actin binding protein43. The CH domains bind to actin with a Kd of ~18 μM44. Utrophin-based probes have been used successfully across a wide range of cell types and species10,19. Similar to Lifeact, at high concentrations, utrophin-based probes can exert deleterious effects on actin cytoskeletal dynamics in both cell nuclei and cytoplasm18,45. A recent study in neurons further demonstrates that care must be taken in the use of utrophin-based probes as one (Utr261) increased primary axon length, dendritic branching, and dendritic complexity, while another (Utr230) did not bind F-actin in neurites of primary hippocampal mouse neurons19.
A third actin-binding domain peptide is F-tractin, a 43 amino acid peptide derived from the rat actin-binding inositol 1,4,5-triphosphate 3-kinase A which binds F-actin with a Kd of ~10 μM10,46,47. Fewer studies have utilized this actin live cell imaging probe10. Due to its larger size (in comparison to other probes), it is possible that F-tractin would sterically hinder binding of actin-binding proteins that regulate and/or facilitate polymerization10. In primary hippocampal neurons, F-tractin-EGFP modified dendritic complexity19. Interestingly, in at least one cell type (i.e., Drosophila nurse cells), F-tractin does not alter actin dynamics in comparison to Lifeact and UtrCH10,45. Thus, for some cell lines, F-tractin might be preferred and worth evaluating versus other F-actin probes10.
Actin-directed nanobodies
A new approach to monitoring actin dynamics in living cells is use of single-domain antibodies, so-called nanobodies. This type of antibody binds to a single antigen and does not require preservation of F-actin’s quaternary structure. An example is Actin-Chromobody which is fused to a GFP-variant for fluorescence detection. As with Lifeact, a downside to cells expressing nanobodies is a high background signal associated with binding to G-actin10. However, in contrast to Lifeact and some of the other F-actin probes, Actin-Chromobody seems to avoid disruption of actin dynamics even at high expression levels10. However, this technology remains very novel and needs a great deal more study and testing10.
Affimer proteins for F-actin
Actin “affimers” are synthetic, actin-binding proteins isolated from a phage library screen20,48,49. Four recently identified actin affimers (designated 2, 6, 14, and 24) were characterized in in vitro and in vivo experiments20. As eGFP-fusion proteins, affimers 6, 14, and 24 labeled F-actin in live cells (1:1 binding stoichiometry, Kds of 0.31 ± 0.17, 0.30 ± 0.05 and 0.38 ± 0.14 μM, respectively; the fourth affimer-GFP fusion protein did not bind F-actin strongly)20. Based on FRAP experiments, eGFP-Affimer 6 behaved most similarly to Lifeact and F-tractin20. Affimer 6 labeled actin structures throughout the cell; however, it failed to colocalize with mCherry-actin in dynamic ruffles, suggesting preferential binding to stable actin filaments20. Affimers 14 and 24 were more likely to either associate with bundled F-actin or were more likely to induce F-actin bundling. Affimer 24 displayed increased signal in structures that resembled focal adhesions. Based on the totality of FRAP results, eGFP-Affimers may preferentially bind to a subset of actin filaments in the cell, and affimers 14 and 24 may be altering actin organization20. To delve deeper into possible affimer-mediated dynamic reorganization of the actin network, live cell, time-lapse imaging for eGFP-affimers 6, 14, and 24 was performed, revealing that all three affimers bound to actin filaments and bundles and could be used to monitor actin dynamics, but to varying degrees and subcellular locations20. For instance, eGFP-affimer 6 labeled both distinct populations of stable actin filaments and those able to depolymerize20. Conversely, eGFP-affimer 14 labeled short F-actin bundles but is not suitable for depolymerization studies20. eGFP-affimer 24 binding revealed dynamic F-actin changes associated in a lamellar area involved in cell adhesion. In cells transfected with the eGFP-affimers, filopodia were short and poorly labelled20. In the time-lapse live cell imaging conditions employed, actin dynamics did not appear to be affected by the three affimers20. However, similar to actin-directed nanobodies, affimer studies are in their infancy, meaning that a great deal more characterization needs to be done to identify any differences in how the affimers may differentially bind F-actin based on distinct structures, cell types, and/or experimental conditions, as well as confirming that actin dynamics are not altered.
Summary
Scientists have more options than ever for visualizing F-actin-based structures in living cells. However, no perfect reagent exists, leaving scientists to weigh the pros and cons of each F-actin probe. Ideally, the best F-actin probe will be sensitive, selective, fluorogenic, very low background, non-toxic, and easily introduced into a wide range of cells across multiple species. Given these parameters, arguably the best option is SiR/SPY actin probes. Notably, it is of paramount importance to confirm that any changes in actin cytoskeleton dynamics/structural organization are physiologically relevant and not artifacts of the probe itself. Thus, use of either a low concentration as recommended on the SiR/SPY datasheets or concentration-response analyses are recommended to insure that the chosen concentration is not altering actin dynamics under control conditions.
References
- Pollard T.D. 2016. What we know and do not know about actin. In: Jockusch B. (eds.) The Actin Cytoskeleton. Handbook of Experimental Pharmacology. vol 235. Springer, Cham.
- Dominguez R. and Holmes K.C. 2011. Actin structure and function. Annu. Rev. Biophys. 40, 169-186.
- Verstraelen P. et al. 2018. Image-based profiling of synaptic connectivity in primary neuronal cell culture. Front. Neurosci. 12, 389.
- Hoover B.R. et al. 2010. Tau mislocalization to dendritic spines mediates synaptic dysfunction independently of neurodegeneration. Neuron. 68, 1067-1081
- Spires-Jones T.L. and Hyman B.T. 2014. The intersection of amyloid beta and tau at synapses in Alzheimer’s disease. Neuron. 82, 756-771.
- Dugina V.B. et al. 2019. Biological role of actin isoforms in mammalian cells. Biochemistry (Mosc). 84, 583-592.
- Hartmann S. et al. 2015. The function of Rho-associated kinases ROCK1 and ROCK2 in the pathogenesis of cardiovascular disease. Front. Pharmacol. 6, 276.
- Bonello T.T. et al. 2009. New approaches to targeting the actin cytoskeleton for chemotherapy. Future Med. Chem. 1, 1311-1331.
- Bryce N.S. et al. 2019. Chemical biology approaches targeting the actin cytoskeleton through phenotypic screening. Curr. Opin. Chem. Biol. 51, 40-47.
- Melak M. et al. 2017. Actin visualization at a glance. J. Cell Sci. 130, 525-530.
- Belin B.J. et al. 2014. Comparative analysis of tools for live cell imaging of actin network architecture. Bioarchitecture. 4, 189-202.
- Lukinavicius G. et al. 2013. A near-infrared fluorophore for live-cell super-resolution microscopy of cellular proteins. Nat. Chem. 132-139.
- Lukinavicius G. et al. 2014. Fluorogenic probes for live-cell imaging of the cytoskeleton. Nat. Methods. 11, 731-733.
- Wu J.-Q. and Pollard T.D. 2005. Counting cytokinesis proteins globally and locally in fission yeast. Science. 310, 310-314.
- Chen Q. et al. 2012. Formins filter modified actin subunits during processive elongation. J. Struct. Biol. 177, 32-39.
- Riedl J. et al. 2008. Lifeact: a versatile marker to visualize F-actin. Nat. Methods. 5, 605-607.
- Riedl J. et al. 2010. Lifeact mice for studying F-actin dynamics. Nat. Methods. 7, 168-169.
- Du J. et al. 2015. Lifeact and Utr230 induce distinct actin assemblies in cell nuclei. Cytoskeleton. 72, 570-575.
- Patel S. et al. 2017. Functional characterisation of filamentous actin probe expression in neuronal cells. PLoS ONE. 12, e0187979.
- Lopata A. et al. 2018. Affimer proteins for F-actin: novel affinity reagents that label F-actin in live and fixed cells. Sci. Rep. 8, 6572.
- D’Este E. et al. 2015. STED nanoscopy reveals the ubiquity of subcortical cytoskeleton periodicity in living neurons. Cell Rep. 10, 1246-1251.
- Hell S.W. and Wichmann J. 1994. Breaking the diffraction resolution limit by stimulated emission: stimulated-emission-depletion fluorescence microscopy. Opt. Lett. 19, 780-782.
- Bar J. et al. 2016. Periodic F-actin structures shape the neck of dendritic spines. Sci. Rep. 6, 37136.
- Liete S.C. et al. 2016. The actin-binding protein α-adducin is required for maintaining axon diameter. Cell Rep. 15, 490-498.
- Wang L. et al. 2019. Small-molecule fluorescent probes for live-cell super-resolution microscopy. J. Am. Chem. Soc. 141, 2770-2781.
- Klementieva N.V. et al. 2016. Fluorescence imaging of actin fine structure in tumor tissues using SiR-actin staining. Anticancer Res. 36, 5287-5294.
- Kim T.H. et al. 2016. Cancer cells become less deformable and more invasive with activation of β-adrenergic signaling. J. Cell Sci. 129, 4563-4575.
- Hashimoto N. et al. 2017. Reversible differentiation of immortalized human bladder smooth muscle cells accompanied by actin bundle reorganization. PLoS ONE. 12, e0186584.
- Narva E. et al. 2017. A strong contractile actin fence and large adhesions direct human pluripotent colony morphology and adhesion. Stem Cell Reports. 9, 67-76.
- Choidas A. et al. 1998. The suitability and application of a GFP-actin fusion protein for long-term imaging of the organization and dynamics of the cytoskeleton in mammalian cells. Eur. J. Cell Biol. 77, 81-90.
- Lemieux M.G. et al. 2014. Visualization of the actin cytoskeleton: different F-actin-binding probes tell different stories. Cytoskeleton. 71, 157-169.
- Small J. et al. 1999. Visualising the actin cytoskeleton. Microsc. Res. Tech. 47, 3–17.
- Sliogeryte K. et al. 2016. Differential effects of LifeAct-GFP and actin-GFP on cell mechanics assessed using micropipette aspiration. J. Biomech. 49, 310-317.
- Lee C.W. et al. 2013. Dynamic localization of G-actin during membrane protrusion in neuronal motility. Curr. Biol. 23, 1046–1056.
- Aizawa H. et al. 1997. A green fluorescent protein-actin fusion protein dominantly inhibits cytokinesis, cellspreading, and locomotion in Dictyostelium. Cell Struct. Funct. 22, 335–345.
- Nagasaki A. et al. 2017. The position of the GFP tag on actin affects the filament formation in mammalian cells. Cell Struct. Funct. 42, 131–140.
- Schachtner H. et al. 2012. Tissue inducible Lifeact expression allows visualization of actin dynamics in vivo and ex vivo. Eur. J. Cell Biol. 91, 923-929.
- Mizoguchi T. et al. 2016. Zebrafish lines expressing UAS-driven red probes for monitoring cytoskeletal dynamics. Genesis. 54, 483-489.
- Munsie L.N. et al. 2009. Lifeact cannot visualize some forms of stress-induced twisted F-actin. Nat. Methods. 6, 317.
- Courtemanche N. et al. 2016. Avoiding artefacts when counting polymerized actin in live cells with LifeAct fused to fluorescent proteins. Nat. Cell Biol. 18, 676-683.
- Flores L.R. et al. 2019. Lifeact-TagGFP2 alters F-actin organization, cellular morphology and biophysical behaviour. Sci. Rep. 9, 3241.
- Burkel B.M. et al. 2007. Versatile fluorescent probes for actin filaments based on the actin-binding domain of utrophin. Cell Motil. Cytoskelet. 64, 822-832.
- Winder S.J. et al. 1995. Calmodulin regulation of utrophin actin binding. Biochem. Soc. Trans. 23, 397S.
- Rybakova I.N. and Ervasti J.M. 2005. Identification of spectrin-like repeats required for high affinity utrophin-actin interaction. J. Biol. Chem. 280, 23018–23023.
- Spracklen A.J. et al. 2014. The pros and cons of common actin labeling tools for visualizing actin dynamics during Drosophila oogenesis. Dev. Biol. 393, 209-226.
- Schell M.J. et al. 2001. Inositol 1,4,5-triphosphate 3-kinase A associates with F-actin and dendritic spines via its N-terminus. J. Biol. Chem. 276, 37537-37546.
- Brehm M.A. et al. 2004. Identification of the actin-binding domain of Ins(1, 4, 5)P3 3-kinase isoform B (IP3K-B). Biochem. J. 382, 353–362.
- Tiede C. et al. 2014. Adhiron: a stable and versatile peptide display scaffold for molecular recognition applications. Protein. Eng. Des. Sel. 27,145–155.
- Tiede C. et al. 2017. Affimer proteins are versatile and renewable affinity reagents. Elife 6, 24903.