Skeletal Muscle Thin Filament Complex (Rabbit Skeletal Muscle from psoas tissue)
Skeletal Muscle Thin Filament Complex (Rabbit Skeletal Muscle from psoas tissue)
* Limited stock available. If stock is not available, Cytoskeleton will produce a new batch upon request. Minimum order will apply. Inquire for more information.
Product Uses
- - Measurement of calcium activated myosin ATPase activity when bound to thin filaments.
- Identification/characterization of proteins or small molecules that affect the SMTFC regulation and myosin ATPase activity
- Identification/characterization of proteins or small molecules that affect myosin / F-actin interaction
Materials
The skeletal muscle thin filament complex (SMTFC) has been assembled from purified F-actin (Cat. # AKL99) and Tropomyosin / Troponin protein (TT) complex (Cat. # TT06). Thus, SMTFC is composed of six proteins: Actin : Tropomyosin α: Tropomyosin β : Troponin C : Troponin I : Troponin T in a stoichiometric ratio of 7:1:1:1:1:1; see Figure 1. After assembly, the thin filaments were centrifuged at 100,000 x g and the pellets resuspended in reaction buffer which purifies the calcium sensitive complex. The complex has been determined to be biologically active in a calcium activat-ed myosin ATPase assay (see biological activity assay). The complex is supplied as a white lyophilized powder.
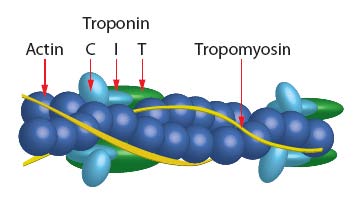
Figure 1: Schematic diagram of muscle thin filament.
Storage and Resonstitution
Briefly centrifuge to collect the product to the bottom of the tube. The protein should be reconstituted to 2 mg/ml by the addition of room temperature (RT) PM12 buffer. Do not pipette vigorously as this will denature the filaments. A white solution will appear first. Leave this for 10 min, then centrifuge at 500 x g to remove air bubbles. The solution should now look nearly clear. Do not centri-fuge at high speed because the filaments will sediment.
The protein will be in the following buffer: 16.8 mM PIPES pH 6.8, 2.8 mM MgCl2, and 2% (w/v) sucrose.
Purity
Protein purity is determined by scanning densitometry of Coomass-ie Blue stained protein on a 4-20% gradient polyacrylamide gel. The purity of the SMTFC is >95% (Figure 2, lane 2).
Figure 2. Thin filament protein analysis
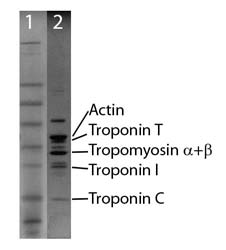
Legend: A 20 µg sample of CFTC protein was separated by electrophoresis in a 4-20% SDS-PAGE system (Lane 2) and stained with Coomassie Blue. Molecular weights are 43 kDa actin, 38 kDa Troponin T, 32 kDa Tropomyosin (α+β), 24 kDa Troponin I, and 18 kDa Troponin C. Protein concentration was measured with the Precision Red™ Protein Assay Reagent (Cat.# ADV02). SeeBlue molecular weight markers (Lane 1, Life Tech Inc.)
Biological Activity Assay
The biological activity of the SMTFC can be determined from its ability to regulate myosin ATPase activity. The SMTFC re-creates coated filaments which are analogous to the thin filaments of muscle fibers. Myosin is added in substoichiometric amounts and the reaction is initiated with ATP and calcium. There is a small amount of calcium present which must be complexed with 2.5 µM EGTA prior to starting the reaction, then in the absence of exoge-nous calcium, SMTFC completely inhibits myosin ATPase. On addition of 10 μM calcium, myosin ATPase will be restored. Calcium binds to Troponin C which dissociates from F-actin, allowing myosin to bind.
Reagents
1. Skeletal Muscle Thin Filament Complex (1 x 1 mg, # CS-TFC02)
2. Skeletal Muscle Myosin S1 (0.25 mg, # MYS04)
3. ATPase Assay Biochem Kit (Cat. # BK051)
4. 100 mM ATP in 50 mM Tris-HCl pH 7.5 (100 ul)
5. PM12 Reaction buffer (12 mM Pipes-NaOH, pH 6.8, 2 mM MgCl2).
6. 250 µM EGTA solution in nanopure water.
Equipment
1. Spectrophotometer capable of measuring absorbance at 360 nm (+/- 5 nm bandwidth). We recommend a Spectra-Max M2 (Molecular Devices). Filter based machines are not suitable.
2. Half area 96 well microtiter plate (Corning Cat.# 3696 or 3697)
3. Multi-channel pipette
Method
The following major steps are recognized:
Step 1. Assemble required reagents and compounds (30 min). Step 2. Prepare Thin Filament stock (15 min)
Step 3. Prepare Motor Mix and plate reader (15 min).
Step 4. Pipette Motor Mix into wells and start reaction/plate reader (10 min).
Thin Filament stock
1. Gently resuspend 1 x 1 mg CS-TFC02 with room temp PM12 buffer to 2 mg/ml; it will be a white solution (500 ul per vial for 1 mg vial). Do not pipette vigorously.
2. Incubate at RT for 10 min.
3. Centrifuge at 500 x g for 30s; now it is a semi-clear solution.
4. Store at room temperature for up to 20 min.
Myosin reaction stock
1. Dilute S1 myosin to 1.0 mg/ml with ice cold PM12 buffer.
2. Mix the following in the stated order at RT, to make 4.0 ml of Myosin/Thin Filament control mixture:
2610 µl of PM12
800 µl of 5x MSEG (this is a BK051 component) 40 µl of 250 µM EGTA solution.
500 µl of CS-TFC02
30 µl of Myosin S1 solution
20 µl of 100 mM ATP
40 µl of 100x PNP (this is a BK051 component) Shelf life 20 min at RT.
3. Using the pre-warmed half area 96-well plate, pipette the Following for Enhancer detection:
4. Pipette 10 µl of 100 µM calcium chloride into “activated” wells.
5. Pipette 10 µl of nanopure water into “non-activated” wells.
6. Pipette 10 µl of 10 x [test compound] into appropriate wells.
7. Incubate at 37°C for 2 min to warm the mixture.
8. Pipette 100 µl of Myosin/Thin Filament mixture into all wells.
9. Start protocol, 41 readings, 30 seconds apart, 37°C , OD 360+/- 5 nm.
10. Calculate Vmax and compare non-activated to calcium acti- vated samples.
Note: For Inhibitor detection add 10 or 20 µM calcium chloride to every well apart from the nanopure water control wells.
Figure 3: Calcium Dose Response Curve
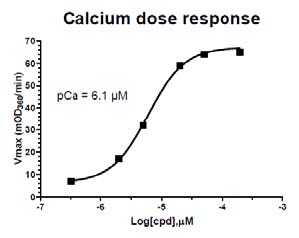
Legend: The ATPase assay was set up as described in the protocol above. Calcium was titrated between 2 and 200 µM and the results plotted on this dose response graph. pCa = 6.1 µM is similar to published pCa values for reconstituted cardiac sarco-meres (Holroyde et al. 1980, Fig.6). The pCa of different batches will vary between 3.0 and 7.0 µM.
References
1. J.M Murray. 1982. Hybridization and reconstitution of the thin filament. Methods Enzymol. 85: 15-17.
2. M.J. Holroyde et al. 1980. The calcium and magnesium binding sites on cardiac troponin their role in the regulation of myofibrillar adenosine triphosphatase. J. Biol. Chem. 255: 11688-11693.
For product Datasheets and MSDSs please click on the PDF links below.
Coming soon! If you have any questions concerning this product, please contact our Technical Service department at tservice@cytoskeleton.com