Fibronectin (Green fluorescent, HiLyte 488)
Product Uses Include
- Observation of fibronectin matrix assembly and cell adhesion
- Cell invasion assays (1)
- FACS analysis
Material
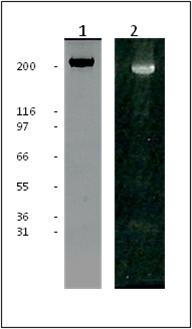
Fibronectin is purified from bovine plasma. Protein purity is determined by scanning densitometry of Coomassie Blue stained protein on a 4-20% polyacrylamide gel. HiLyte Fluor™ 488 labeled fibronectin is >80% pure (Figure 1).
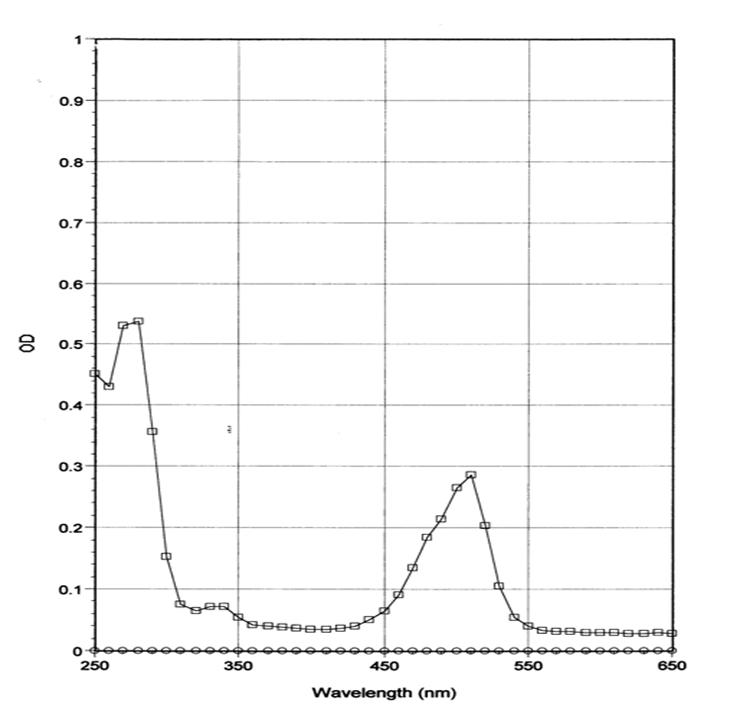
The protein is modified to contain covalently linked HiLyte Fluor™ 488 at random surface lysines (2). An activated ester of the fluorochrome is used to label the protein. Labeling stoichiometry is determined by spectroscopic measurement of protein and dye concentrations. Final labeling stoichiometry is 1-3 dyes per protein molecule (Figure 2). HiLyte Fluor™ 488 labeled fibronectin can be detected using a filter set of 350-450nm excitation and 500-550 nm emission.
Fibronectin runs as individual subunits on SDS-PAGE with an apparent molecular weight of 230 kDa. FNR02 is supplied as an orange lyophilized powder. Each vial of FNR02 contains 20 µg protein.
Purity
Purity is determined by scanning densitometry of proteins on SDS-PAGE gels. Samples are >80% pure.

Figure 1: HiLyte Fluor™ 488 labeled Fibronectin Purity Determination
Legend: 20 µg of unlabeled fibronectin (Lane 1) and 20 µg of HiLyte Fluor™ 488 labeled fibronectin (Lane 2) was separated by electrophoresis in a 4-20% SDS-PAGE system. The unlabeled protein was stained with Coomassie Blue and visualized in white light. The HiLyte Fluor™ 488 labeled protein was visualized under UV light, no free dye was observed in the dye front. Protein quantitation was determined with the Precision Red™ Protein Assay Reagent (Cat. # ADV02). Mark12 molecular weight markers are from Invitrogen

Figure 2: Absorption scan of HiLyte Fluor™ 488 labeled fibronectin in solution
Legend: FNR02 was diluted with Milli-Q water and its absorbance spectrum was scanned between 250 and 650 nm. HiLyte Fluor™ 488 labeling stoichiometry was calculated to be 1-3 dyes per fibronectin protein using the absorbancy maximum for at 527 nm and the Beer-Lambert law. Dye extinction coefficient when protein bound is 70,000M-1cm-1
References
- Artym VV. Et al. 2009. ECM degradation assay for analyzing local cell invasion. Methods in molecular biology, Extracellular matrix protocols, vol. 522: 211-219.Humana Press.
- Use of this product employs the following patent rights licensed to Cytoskeleton, Inc. from Anaspec, Inc.: (a) the claims of U.S. Patents No. 7,754,893, 7,820,783 and 7,790,394; (b) any claims issuing from U.S. Patent Applications Serial No. 12/804,065, 12/807,268 and 12/925,505; and (c) all patents to be issued pursuant thereto, and all continuations, continuations –in-part, reissues, substitutes, and extensions thereof. The use of this product is limited to the field of use comprising internal use by an end user of this product solely in in vivo and in vitro cell staining or biochemical assay applications, such as IHC, HCS, FACS, in vitro assays of an end user only for scientific R&D purposes. The filed of use of this product explicitly excludes the following actions: (a) generating data from clinical applications in humans and animals; and (b) generating QC or QA data for the validation of health, food or cosmetic products.
For product Datasheets and MSDSs please click on the PDF links below. For additional information, click on the FAQs tab above or contact our Technical Support department at tservice@cytoskeleton.com
Question 1: What is the optimal excitation and emission filter settings to visualize the HiLyte Fluor™ 488 fluorescence?
Answer 1: HiLyte Fluor™ 488 labeled-fibronectin can be detected using a filter set of 502 nm excitation and 527 nm emission.
Question 2: What is the labeling stoichiometry?
Answer 2: HiLyte Fluor™ 488 labeling stoichiometry was calculated to be 1-3 dyes per fibronectin protein using the absorbancy maximum for HiLyte 488™ at 527 nm and the Beer-Lambert law. Dye extinction coefficient when protein bound is 70,000 M-1cm-1.
If you have any questions concerning this product, please contact our Technical Service department at tservice@cytoskeleton.com


