Cytoskeleton Kit (SiR-Actin and SiR-Tubulin)
CY-SC006 has been discontinued. SiR-Actin (CY-SC001) and SiR-Tubulin (CY-SC002) are still available individually. Additionally, there are several different versions of the live cell actin and tubulin probes from Spirochrome which may allow for dual labeling with the SiR products. Please see Spirochrome's SPY probes for additional options.
Cytoskeleton kit combines one vial of 50 nmol SiR-actin and one vial of 50 nmol SiR-tubulin. It enables to stain at will one or both of the two main components of the cytoskeleton. Each probe allows for 50 – 200 staining experiments*. Cytoskeleton kit simplifies cytoskeleton imaging and is cost efficient.*
Optical properties
λabs 652 nm
λEm 674 nm
εmax 1.0·105 mol-1·cm-1
*Based on the following conditions: 0.5 – 1 ml staining solution / staining experiments with 0.5 – 1 uM probe concentration. The number of staining experiments can be further increased by reducing volume or probe concentration.
Cytoskeleton, Inc. is the exclusive provider of Spirochrome, Ltd. products in North America.
For product Datasheets and MSDSs please click on the PDF links below.
Spirochrome Technical Tips and Ex/Em spectra in graphical form (PDF)
Q1. What is STED microscopy and how does it work?
A1. STED microscopy stands for Stimulated Emission Depletion microscopy. It is one type of super resolution microscopy which allows the capture of images with a higher resolution than conventional light microscopy which is constrained by diffraction of light. STED uses 2 laser pulses, one is the excitation pulse which excites the fluorophore, causing it to fluoresce. The second pulse, referred to as the STED pulse, de-excites the fluorophore via stimulated emission in an area surrounding a central focal spot that is not de-excited and thus continues to fluoresce. This is accomplished by focusing the STED pulse into a ring shape, a so-called donut, where the center focal spot is devoid of the STED laser pulse, conferring high resolution to the fluorescent area (Fig. 1; see Ref. 1 for more details on STED microscopy).
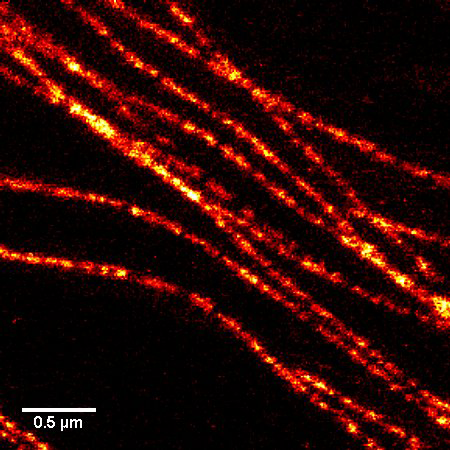
Figure 1. STED microscopic image of microtubules labeled with SiR-tubulin in human primary dermal fibroblasts.
Q2. Why is the SiR actin (or tubulin) probe good for STED microscopy?
A2. STED microscopy offers the ability to study cellular details on a nanometermolar scale in vivo. To take advantage of this super resolution microscopy, one must be able to select with high specificity the area to be examined using fluorescent probes. In addition, the fluorescent probes must be bright, photostable, exhibit no or little phototoxicity, be excited and emit in the far red spectrum. In addition, if the probe is to be used for live cell imaging (thus avoiding fixation artifacts that occur when cells are fixed), high cell permeability is necessary. The SiR actin and tubulin probes fulfill all of these requirements. In short, the combination of STED and SiR probes allows for unparalleled fluorescent visualization of subcellular actin and tubulin/microtubule structures and their physical characterization in living cells, (see Fig. 2 and Ref. 2).
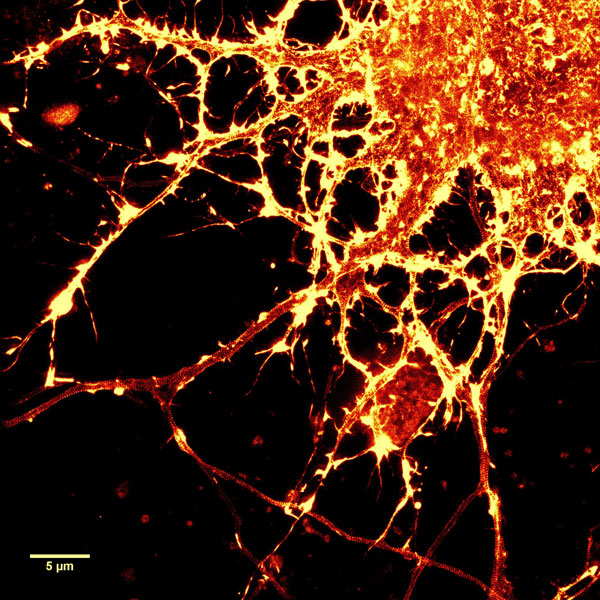
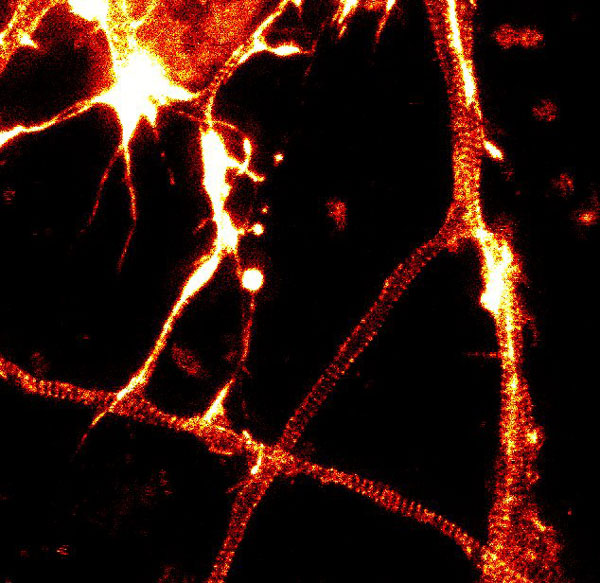
Figure 2. STED images of cultured rat hippocampal neurons stained with SiR-actin. Bottom image is a close-up view of part of the top image to clearly visualize actin rings (stripes) with 180 nm periodicity. Courtesy Of Elisa D'Este, MPI Biophysical Chemistry, Göttingen.
Q3. What are the filter sets for these probes?
A3. The SiR actin and tubulin probes are visualized with standard Cy5 filters. Optimal excitation is 650 nm and emission is 670 nm. We recommend filters with an excitation of 630 + 20 nm and an emission of 680 + 20 nm (Fig. 3).
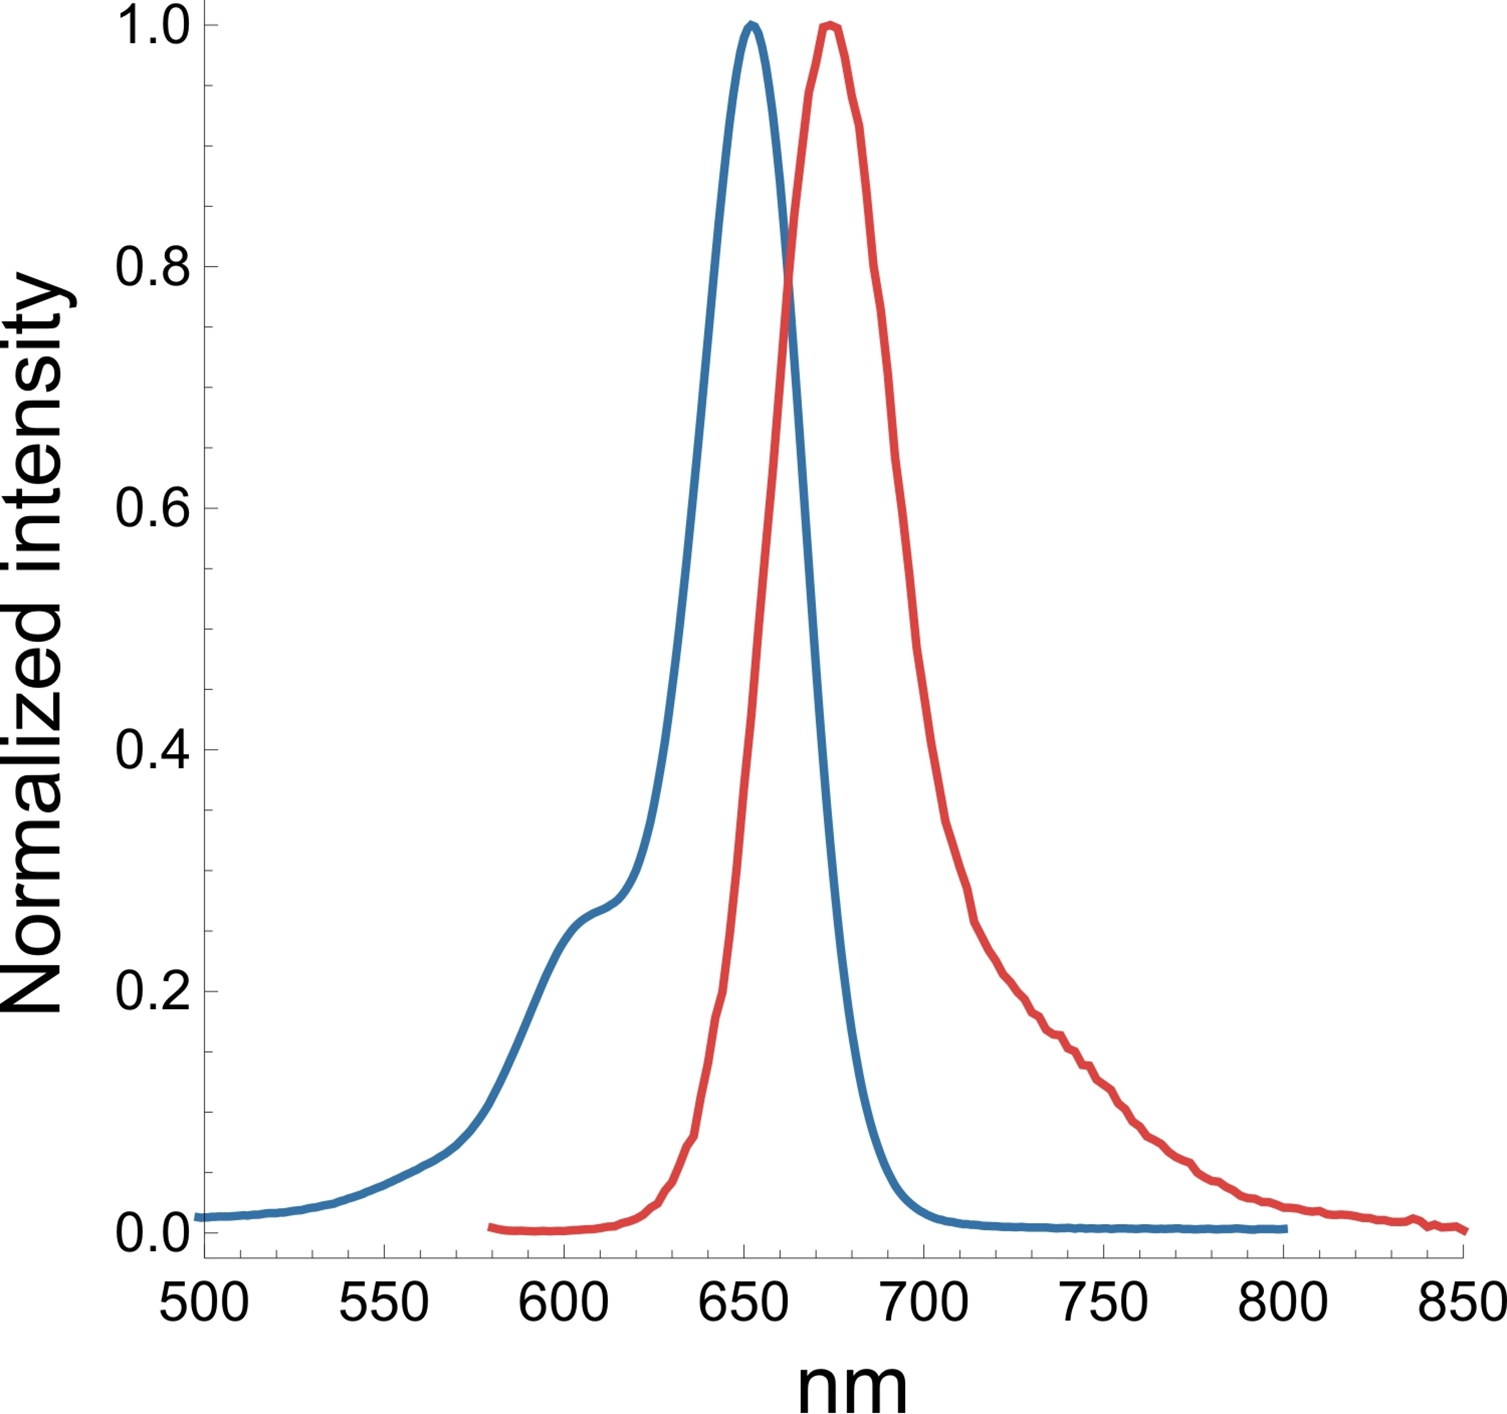
Figure 3. Excitation (blue) and emission (red) spectra for SiR probes.
Q4. Why do the SiR probes have a low background compared to other fluorophores?
A4. SiR probes are excited by and emit light in the near infrared/far red spectral range, thus avoiding the use of shorter wavelengths such as blue and green light that typically autofluoresce, causing higher background signals. SiR-coupled probes possess two physical states: 1. a non-fluorescent, closed off-state (spirolactone) and 2. an open, highly fluorescent on-state (zwitterion). The binding of the probe to its ligand target favors the highly fluorescent open state while the free unbound probe exists in the closed, non-fluorescent state (Fig. 4). The fluorescence amplification is 100-fold from the unbound to bound state. This results in a highly sensitive biosensor in which the majority of fluorescence occurs only in the bound state (see Refs. 3 and 4).

Figure 4. SiR derivatives exist in equilibrium between the fluorescent zwitterionic (open) form (left structure) and the non-fluorescent spiro (closed) form (right structure).
Q5: Are the SiR probes stable at room temperature?
A5: Yes, the probes are stable at room temperature for a few days. However, it strongly depends on the probe and the solvent. Thus, it is recommended to store all of the probes or solutions at –20°C.
Q6: Are SiR-actin and SiR-tubulin toxic to cells?
A6: Yes, above a certain threshold both probes show some effect on cell proliferation and altered actin or microtubule dynamics. However, the probes are orders of magnitude less toxic than their parent drug. In HeLa cells, neither actin nor microtubule dynamics were altered at concentrations below 100 nM. At this concentration, SiR probes efficiently label microtubules and F-actin, allowing for the capture of high signal to noise images.
Q7: Do the probes work on fixed cells?
A7: SiR-actin probes can be used with PFA-fixed cells. SiR-actin labels F-actin in PFA-fixed cells as efficiently as phalloidin derivatives. SiR-tubulin labels microtubules only in ethyleneglycol-bis-succinimidyl-succinate (EGS)-fixed cells. However, a selective labeling of centrosomal microtubules of PFA-fixed cells was observed. SiR-actin and SiR-tubulin are not suitable for methanol-fixed cells.
Q8: Is it possible to image SiR-probes by STORM?
A8: No—under the very high light intensities typically used in STORM imaging, a phototoxic effect is observed on live cells.
Q9: Which organisms and tissues are stained by SiR-probes?
A9: This list describes only cell lines, tissues, or organisms that have been reported to work. Omission of a cell line, tissue, or organism does not mean that the SiR-probes will not work with the specific cells, tissues, or organisms.
Homo sapiens: U2OS, fibroblasts, HeLa, HUVEC, MCF-10A, HCT-116, A549, erythrocytes
Mus musculus: C2C12, IA32, skeletal muscle, primary cardiomyocyte, primary oocyte
Rattus norvegicus: primary hippocampal neurons, primary cortical neurons, NRK
Cercopithecus aethiops: COS-7
Mesocricetus auratus: BHK
Drosophila melanogaster: Notum epithelium, S2
Didelphis marsupialis: OK cells
Q10. Do SiR-probes work in 3D cell cultures?
A10: Yes, the probes are able to stain cells in a 3D growth environment.
Q11: What are the correction factors CF260 and CF280for the SiR fluorophore?
A11: CF260 = 0.116 and CF280 = 0.147
References
1. Hell S.W. and Wichmann J. 1994. Breaking the diffraction resolution limit by stimulated emission: stimulated-emission-depletion fluorescence microscopy. Opt. Lett. 19, 780-782.
2. D’Este E. et al. 2015. STED nanoscopy reveals the ubiquity of subcortical cytoskeleton periodicity in living neurons. Cell Rep. 10, 1246-1251.
3. Lukinavicius G. et al. 2013. A near-infrared fluorophore for live-cell super-resolution microscopy of cellular proteins. Nat. Chem. 5, 132-139.
4. Lukinavicius G. et al. 2014. Fluorogenic probes for live-cell imaging of the cytoskeleton.Nature Methods. 11, 731-733.

